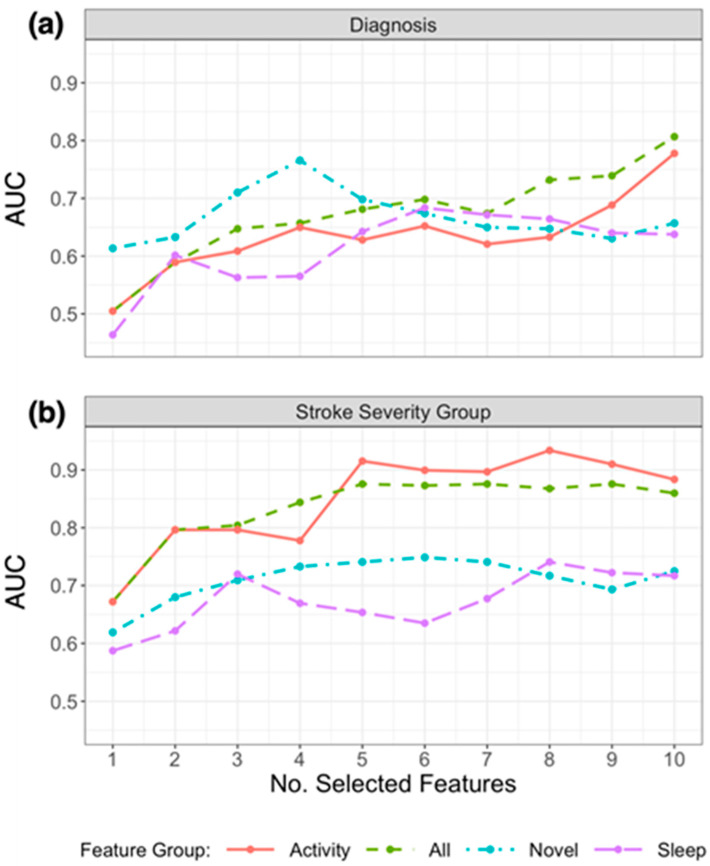
Figure 3.
Plot of AUC results for replicating (a) diagnosis labels and (b) stroke severity group using logistic regression, by the number of selected features chosen using RRCT in descending order of importance. Feature groups are as defined in the first column of Table 1, and the top 10 selected features from each group are presented in Table 3. The horizontal axis indicates the number of selected features presented into the statistical learner, in descending order of selection as determined using RRCT (i.e., the first feature is the top choice of RRCT, the second feature is the second choice etc.).

