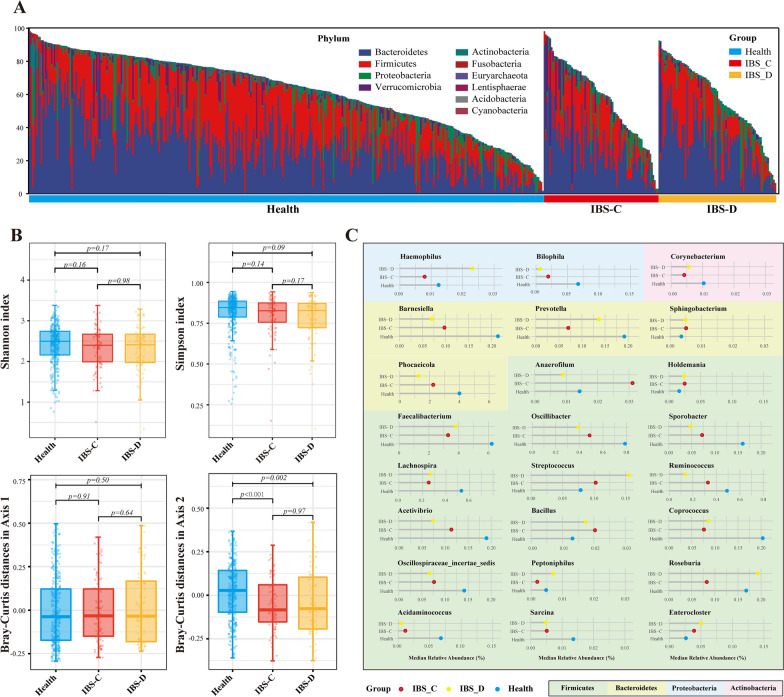
Fig. 4.
Subgroup analysis of the microbial compositions in different IBS subtypes. A: The vertical bar chart presenting the microbiota compositions among IBS with predominant constipation (IBS-C), predominant diarrhea (IBS-D) and healthy controls at the phylum level. B: Boxplots of the Shannon and Simpson index among the three groups. C. Horizontal Lollipop plots representing the median relative abundance of significantly enriched or depleted genera among the three groups. The background colors represent the different phyla they belong to. Kruskal-Wallis Test was performed and *, **, *** stands for p-value < 0.01, 0.005 and 0.001, respectively)

