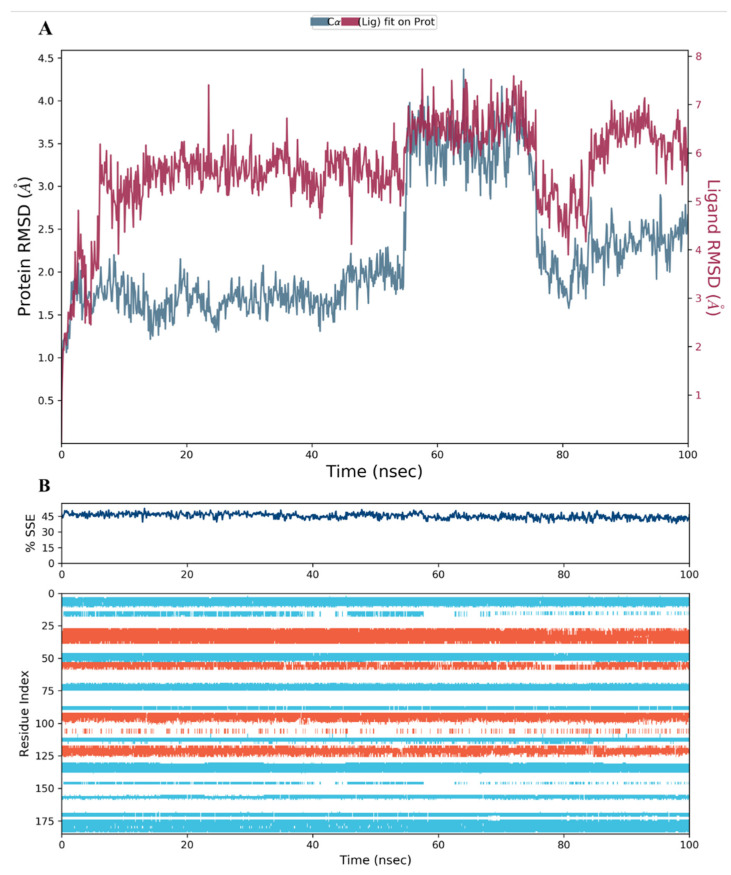
Figure 12.
(A) The RMSD plot for compound 34 complexed with hDHFR (PDB: 1KMV) over a 100 ns simulation time; (B) Stability of the hDHFR secondary structure over 100 ns of MD simulation when complexed with 34. Protein secondary structure elements (SSE) like alpha-helices (orange color) and beta-strands (light blue color) were monitored during the simulation. The upper plot reported SSE distribution by residue index across the protein structure, and the plot at the bottom monitored each residue and its SSE assignment over the simulation time.

