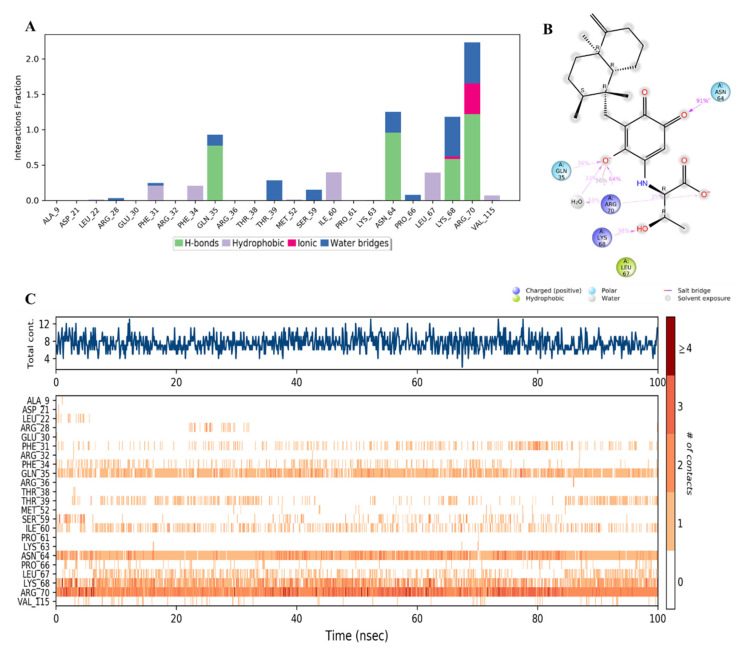
Figure 16.
(A) Stacked bar graph of hDHFR (PDB: 1KMV) interactions with compound 34 throughout the simulation. The values were normalized over the course of the trajectory. (B) A diagram illustrating the detailed connections of 34 with hDHFR. The coordination that appears at least 30% of the designated time period (0.00 to 100.00 nsec) will be presented. It is possible to observe more than 100% as some residues might be linked to the same ligand atom more than once; the pink colored arrows represent the hydrogen bond interaction while the % on the arrows represent the coordination % during the simulation time. (C) Timeline of hDRFR-34 interactions presented in A. The top panel presents the total number of specific interactions the protein made with the ligand over the course of the trajectory. The bottom panel presents the residues interacting with the ligand in each trajectory frame. The dark orange color indicates more than one specific interaction is made between some residues and the ligand. As the orange color becomes lighter, the number of contacts between the residue and ligand decreases. The white color indicates no interaction is formed.

