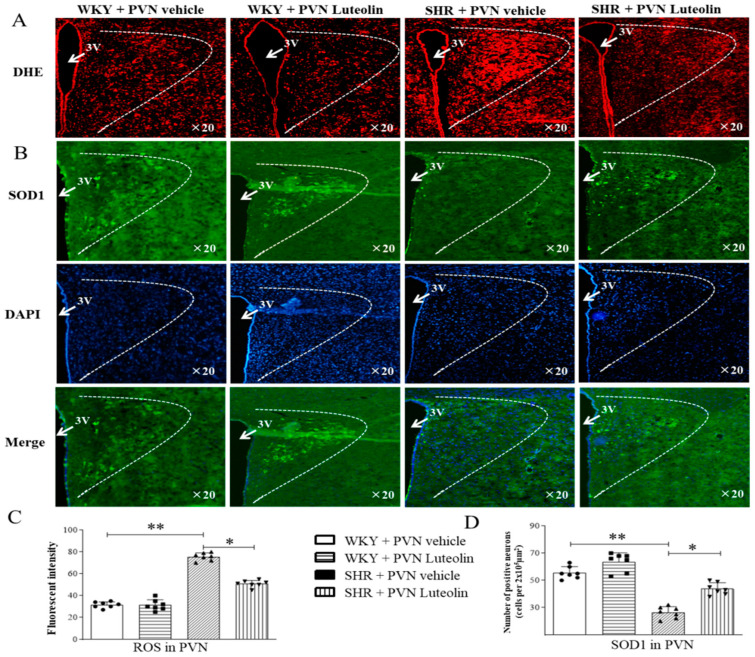
Figure 2.
Effects of PVN luteolin on ROS and SOD1 in PVN. (A) A representative fluorescent microphotographs depicting the superoxide production as detected with dihydroethidium staining (DHE, red fluorescence). (B) A representative fluorescent microphotographs revealing SOD1 positive cells (green fluorescence). Quantification analysis of red fluorescence of DHE (C) and green fluorescence of SOD1 (D) positive cells in PVN of SHRs and WKY rats, treated with luteolin or aCSF. Values are the mean ± SEM from 7 rats/group. * p < 0.05, ** p < 0.01. 3V, third ventricle.

