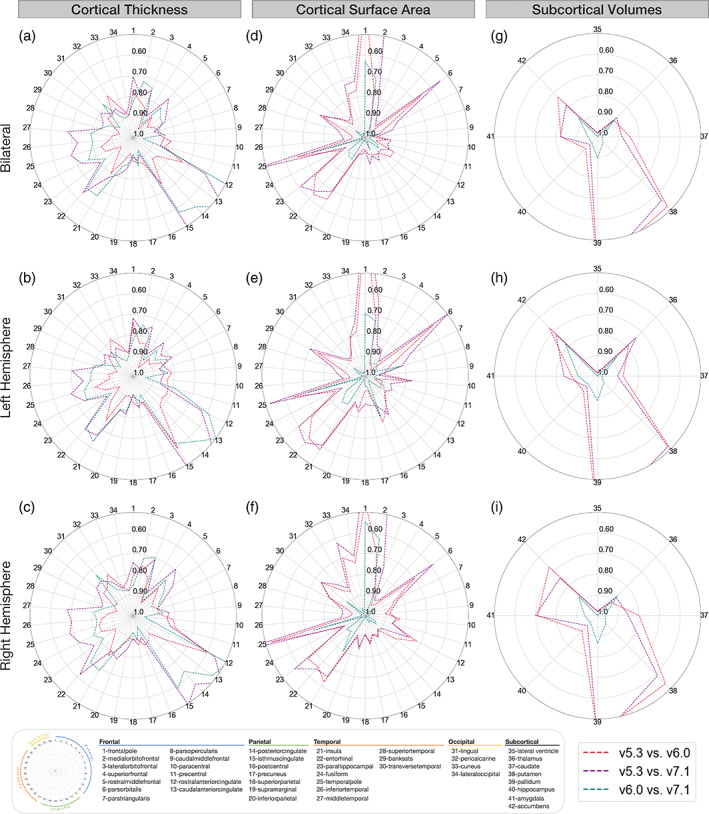
FIGURE 1.

Regional interversion agreement (compatibility; estimated by ICC2). Bilateral, left, and right ICC2 values comparing cortical thickness (a–c), cortical surface area (d–f), and subcortical volumes (g–i) between versions. Outer concentric circles represent lower ICC2 values, truncated at 0.50, while the center represents ICC2 = 1. Regions with the lowest compatibility differ for cortical thickness and surface area. These compatibility estimates shown are a sample‐size weighted average of results in each of Human Connectome Project (HCP), Kennedy Krieger Institute (KKI), and Open Access Series of Imaging Studies (OASIS) data sets.
