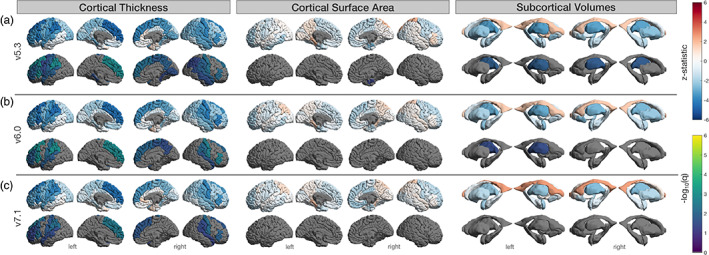
FIGURE 7.

Regional age associations in subjects with no segmentation quality issues. Results based on n = 69 (cortical) and 61 (subcortical) of the 106 neurologically healthy UK Biobank participants. (a) FreeSurfer v5.3, (b) v6.0, and (c) v7.1. Top row indicates the z‐statistic and bottom indicates −log10(q < 0.05) for left and right surface area, thickness, and subcortical volumes. Several regions found to be significant in the full sample of n = 106 did not survive false discovery rate (FDR) correction here.
