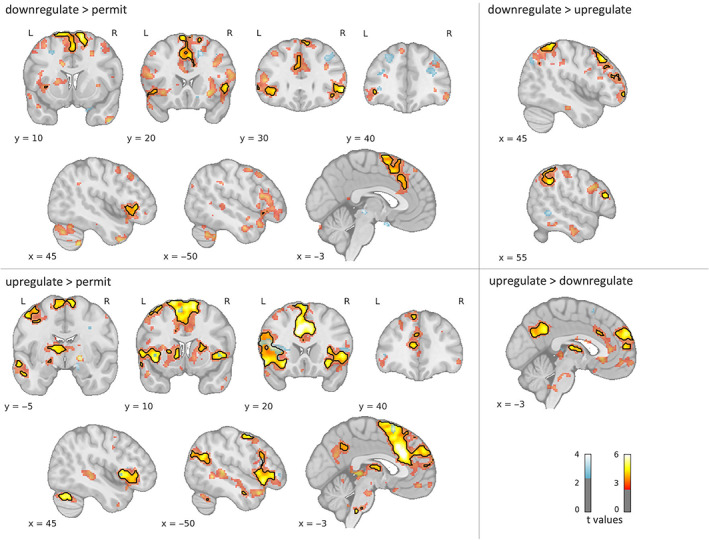
FIGURE 3.

Whole‐brain activations for controls (HC: Red‐yellow) and frontal lobe epilepsy (FLE) patients (blue). Black contours delineate significant clusters (p FWE < .05). To illustrate the larger pattern, color‐coded activation maps are thresholded with p uncorr < .01 and a cluster threshold of 30 voxels for display purposes. L, left; R, right
