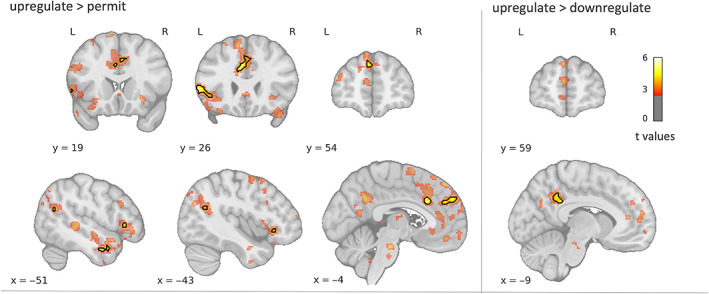
FIGURE 5.

Whole‐brain activations for controls > patients. Black contours indicate significant clusters (p FWE < .05). To illustrate the full activation pattern, color‐coded maps are thresholded with p uncorr < .01 and a cluster threshold of 30 voxels. For upregulate > permit, controls displayed higher activations in task‐relevant distributed left‐sided regions, including dorsomedial and ventrolateral prefrontal cortex, angular gyrus and lateral temporal gyrus. For upregulate > downregulate, controls displayed higher activity in the left posterior medial parietal cortex. L, left; R, right
