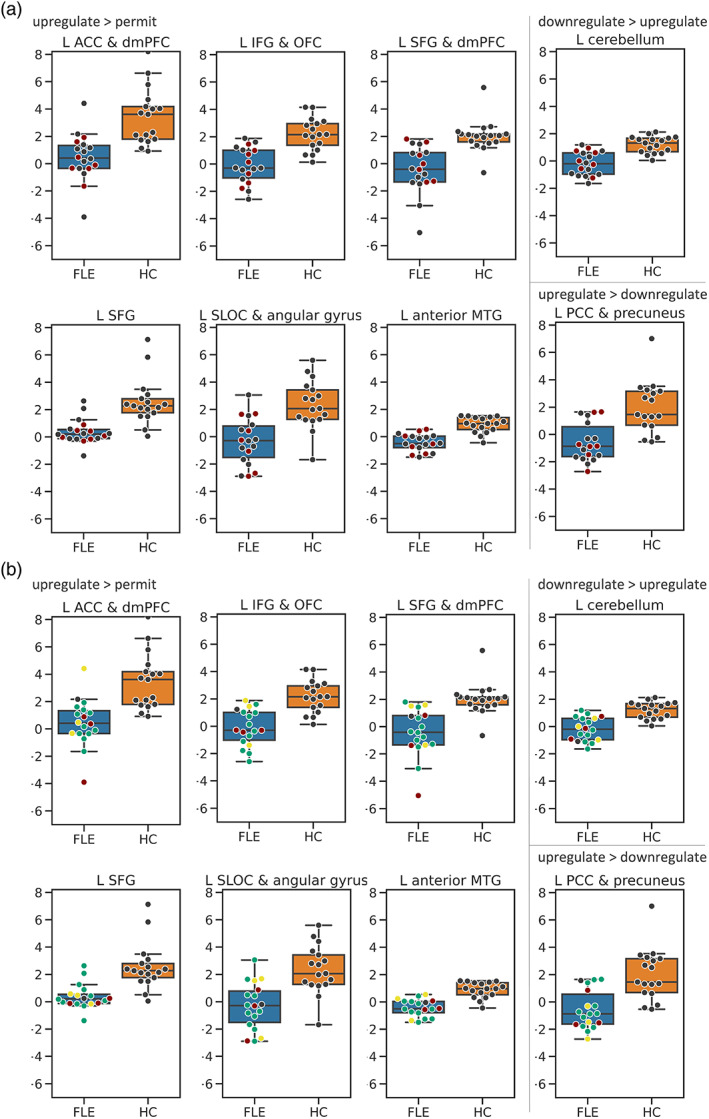
FIGURE 6.

Box‐plots of controls (HC, orange) and frontal lobe epilepsy (FLE, blue) patients for clusters in which groups differed during upregulation > permit or upregulation versus downregulation (L cerebellum and L PCC & precuneus). The y‐axis shows beta estimates. Dots represent individual data points. (a) Red dots represent FLE patients with epileptogenic frontal lesions. Grey dots represent FLE patients without epileptogenic frontal lesions. (b) Red dots represent right‐sided, green dots represent left‐sided, and yellow dots represent bilateral FLE patients. A grey dot represents one patient with unknown focus lateralization. Based on visual inspection, neither the presence of an epileptogenic lesion, nor focus lateralization strongly influenced activation patterns of FLE patients. ACC, anterior cingulate cortex; dmPFC, dorsomedial prefrontal cortex; IFG, inferior frontal gyrus; L, left; MTG, middle temporal gyrus; OFC, orbitofrontal cortex; PCC, posterior cingulate cortex; SFG, superior frontal gyrus; SLOC, superior lateral occipital cortex
