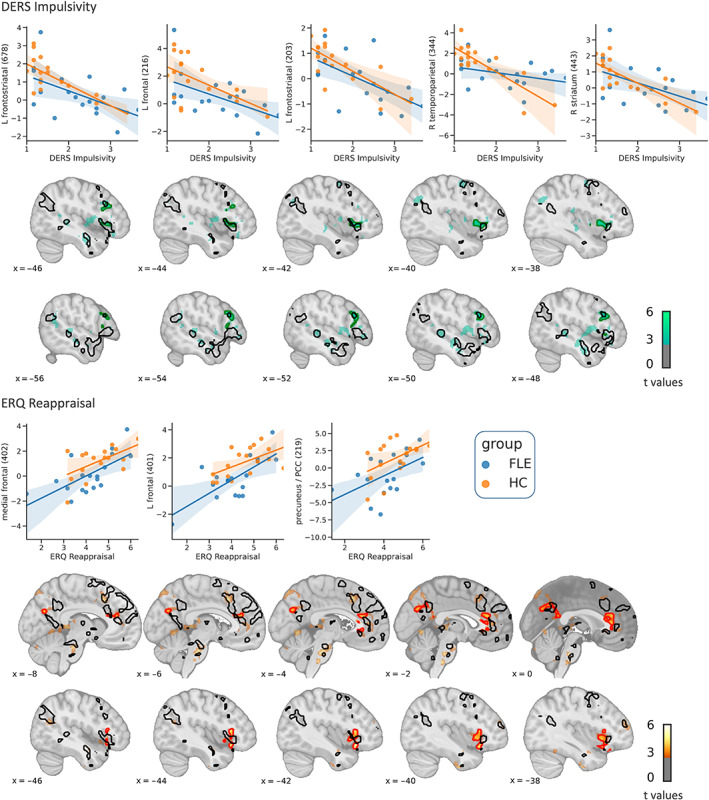
FIGURE 7.

Whole‐brain results of the regression analysis. Green (negative correlations) or red (positive correlations) contours indicate significant correlations of upregulate > permit with impulsivity (upper panel) and reappraisal (lower panel; p FWE < .05). Black contours show regions in which healthy controls (HC, Orange dots) displayed higher activations than frontal lobe epilepsy (FLE, Blue dots) patients during upregulation, thresholded at p uncorr < .01 (see also Figure 5). For display purposes, activation maps are thresholded with p uncorr < .01 and a cluster threshold of 30 voxels. Scatterplots are shown only for visual inspection and not used for statistical inference. The y‐axis shows beta estimates. The number in brackets denotes the cluster size in voxels. DERS, difficulties in emotion regulation scale; ERQ, emotion regulation questionnaire. Left‐sided ventrolateral prefrontal activations that negatively correlated with DERS’ impulsivity scale (upper panel) and positively correlated with ERQ's reappraisal scale (lower panel) descriptively overlapped with higher upregulation‐related activity for controls compared to patients. Note that activity reductions in FLE patients compared to HC that are visible in the scatterplots, were significant (p uncorr < .05) in all regions but the right striatum and right temporoparietal cortex
