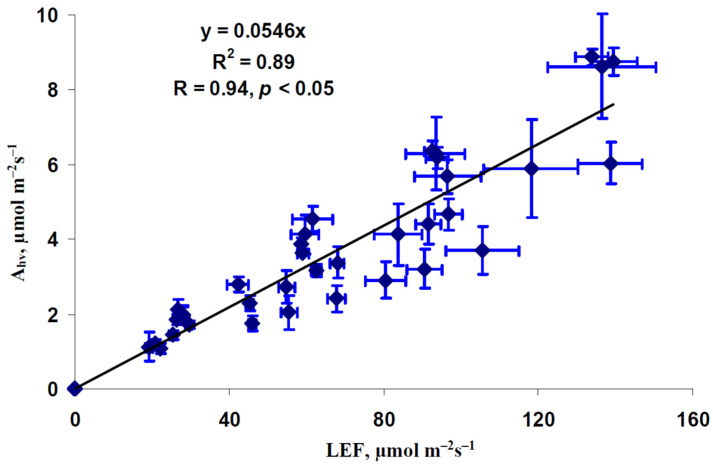
Figure 3.
Scatter plot of the photosynthetic CO2 assimilation rate (Ahv) and linear electron flow (LEF) in lettuce plants (n = 45). All average values of Ahv and LEF from Figure 2 were used. R2 and R are the determination and correlation coefficients.

