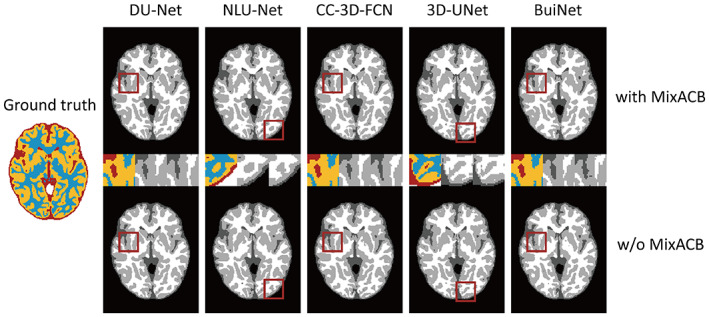
FIGURE 5.

Visualization of the segmentation results on different models with (w) and without (w/o) the MixACB. The ground truth map is shown in color, and CNNs‐based segmentation maps are shown in the gray scale. The regions in the red square are magnified in the middle row following an order from with MixACB to without MixACB.
