Table 2.
HOMO-LUMO plots for the lowest energy electronic transitions (S0→S1), transition energies in nm, and oscillator strengths (in parentheses), ƒ, for the main peak at the Soret band, and the two main peaks of the Q-band in DCM, for corroles 1–4. The data for the Soret peak was calculated as the average for the two theoretically intense peaks (see Supplementary Materials). This was done to allow a better comparison with the experimental results.
| Corrole | HOMO Plot | LUMO Plot | Soret Band (f) | Q Bands (f) |
|---|---|---|---|---|
| 1 |
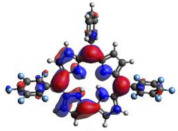
|
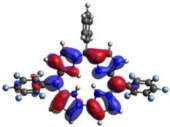
|
390.98 (1.1256) |
535.89 (0.1006);
555.81 (0.2818) |
| 2 |
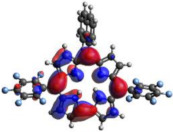
|
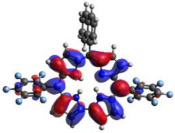
|
367.33 (1.3793) |
547.84 (0.1095);
564.03 (0.2953) |
| 3 |
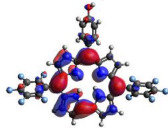
|
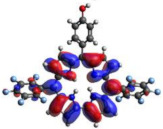
|
371.05 (1.3838) |
554.66 (0.0884);
575.63 (0.3254) |
| 4 |
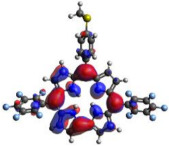
|
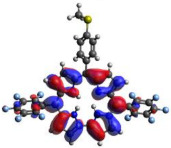
|
371.99 (1.4419) | 553.48 (0.0835); 573.47 (0.3171) |
