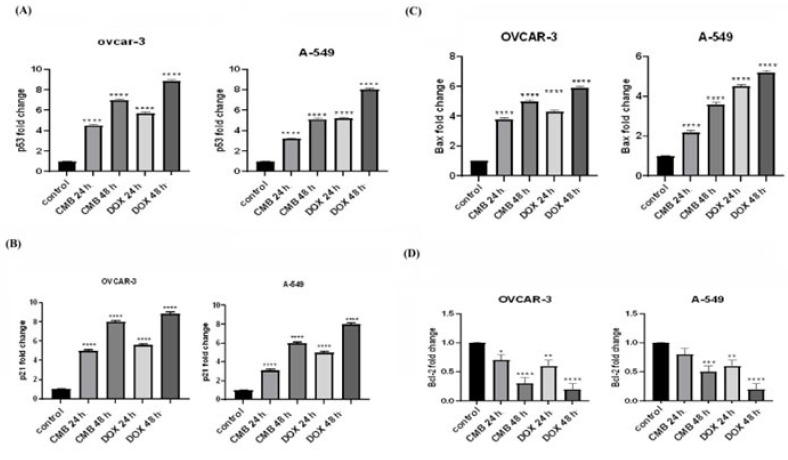
Figure 4.
Molecular evaluation of gene expression in OVCAR-3 and A-549 cells after incubation with CMB or doxorubicin IC50 values for 24 h or 48 h. Relative gene expression is represented as mean ± SEM. (A) P53 gene expression in OVCAR-3 and A-549 cells. (B) P21 gene expression in OVCAR-3 and A-549 cells. (C) Bax mRNA level in OVCAR-3 and A-549 cells. (D) Bcl2 mRNA level in OVCAR-3 and A-549 cells. Means and SE were calculated from three independent experiments. Statistically significant results compared to untreated control were displayed as: * p < 0.05; ** p < 0.01; *** p < 0.001; **** p < 0.0001.

