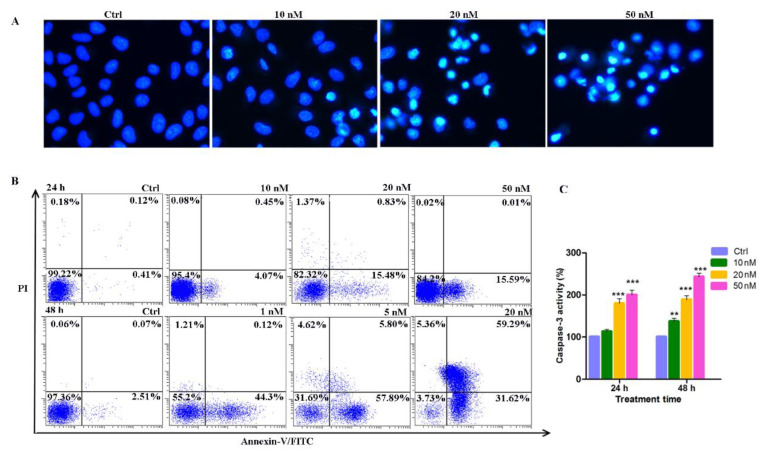
Figure 4.
Induction of apoptosis by compound 14b. (A) The Hoechst 33342 staining of A549 cells after treatment with compound 14b at the indicated concentrations for 24 h. (B) The percentages of cells in each apoptosis quantitated by flow cytometry through Annexin V-FITC double staining analysis. Upper left quadrant (Annexin V−/PI+): necrotic cells; upper right quadrant (Annexin V+/PI+): late apoptotic cells; bottom left quadrant (Annexin V−/PI−): live cells; bottom right quadrant (Annexin V+/PI−): early apoptotic cells. (C) The caspase 3 activity detected by the caspase 3 colorimetric assay kit after A549 cells were treated with compound 14b at concentrations of 10, 20 and 50 nM for 24 h. The experiments were performed at least three times, and the results of the representative experiments are shown. Data are presented as mean ± SEM. ** p < 0.01, *** p < 0.001 vs. control group; significant difference as compared with the control group by t test.

