
Fig. 3.
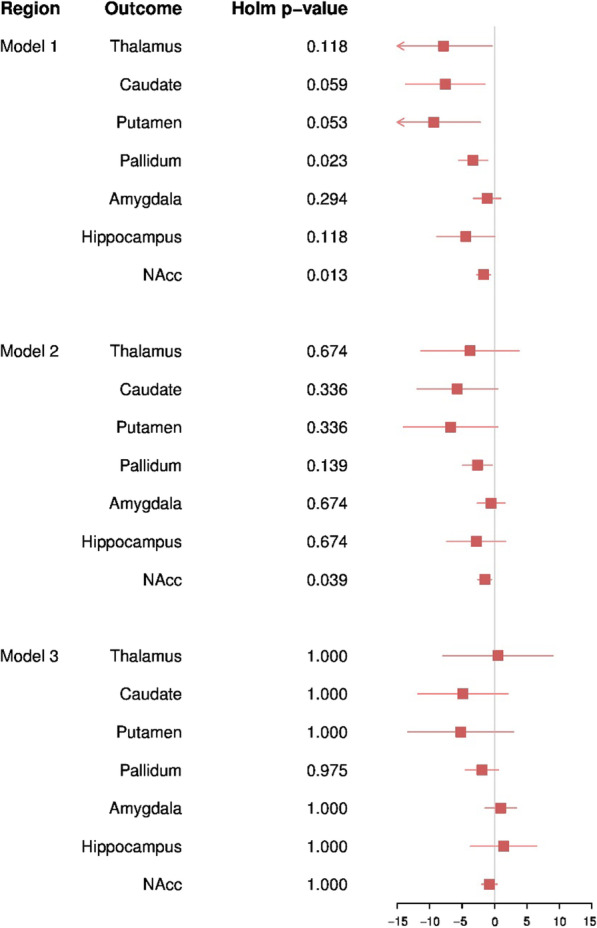
Forest plot depicting results from regression modelling of the association between the SRS and subcortical ROIs. Corrected p values were generated using holm correction for multiple testing. NAcc: nucleus accumbens. Model 1 was adjusted for child age, sex, ethnicity, family income, and ABCD recruitment site. Model 2 was adjusted for the covariates included in model 1 with the addition of cognition score. Model 3 was adjusted for the covariates included in model 2 with the addition of externalising symptoms and internalising symptoms