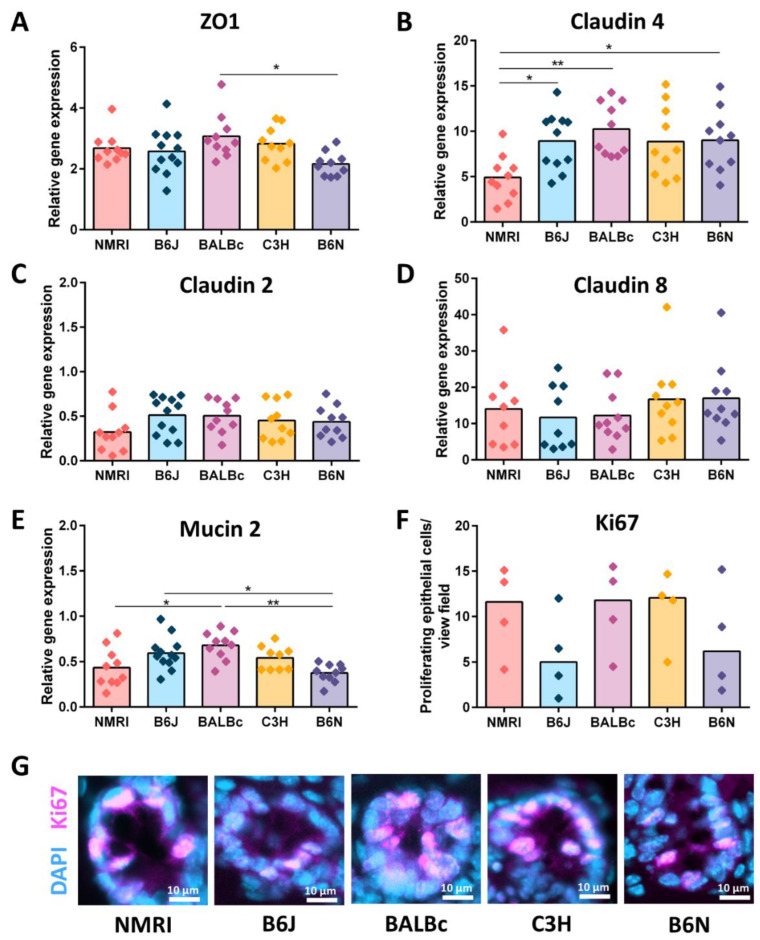
Figure 3.
Involvement of epithelial barrier factors in cecal enlargement. (A–D) Gene expression of epithelial tight junctions: (A) ZO1, (B) Claudin 4, (C) Claudin 2, and (D) Claudin 8 measured by qPCR in total RNA isolated from the cecal tissue of five GF strains (NMRI, B6J, BALBc, C3H and B6N). Relative differences in gene expression were calculated by the comparative 2−ΔΔCt method. Statistical differences were calculated by one-way ANOVA with a Tukey’s post-hoc test * p < 0.05, ** p < 0.01. Box plot indicates mean. Each symbol represents one independent sample. (E) Gene expression of mucin 2 measured by qPCR in total RNA isolated from cecal tissue of five GF strains (NMRI, B6J, BALBc, C3H and B6N). One-way ANOVA with Tukey’s post-hoc test * p < 0.05, ** p < 0.01. Box plot indicates mean. Each symbol represents one independent sample. (F) Quantification of proliferating epithelial cells (Ki67+ cells) in the cecal tissue of five GF strains (NMRI, B6J, BALBc, C3H and B6N; n = 4). Kruskal-Wallis test with Dunn´s multiple comparison test. Box plot indicates median. Each symbol represents one independent sample. (G) Representative immunostaining for Ki67 (violet) on cecal sections obtained from five GF strains (NMRI, B6J, BALBc, C3H and B6N; n = 4). Nuclei (light blue) were counterstained with DAPI. Scale bars 50 µm. Abbreviations: ZO-1, Zonula occludens 1; GF, germ-free.

