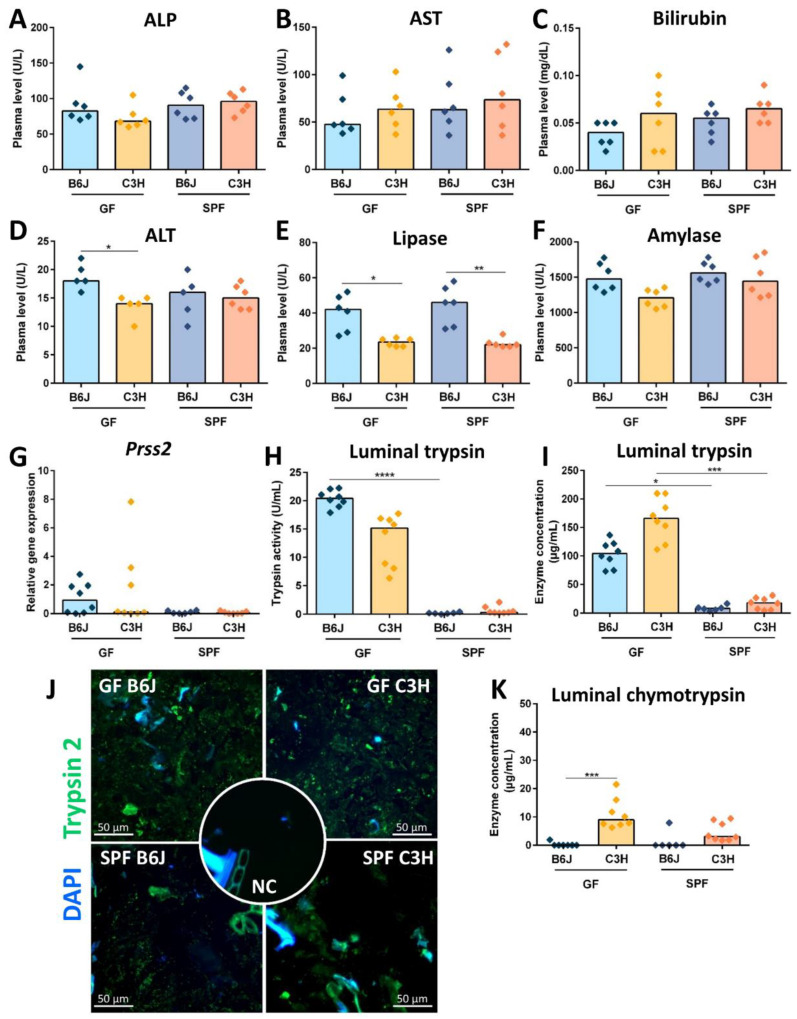
Figure 6.
Contribution of digestion enzymes to the cecal enlargement. (A–D) Liver enzymes: (A) alkaline phosphatase (ALP), (B) aspartate aminotransferase (AST), (C) bilirubin, and (D) alanine aminotransferase (ALT) determined in plasma of GF and complex microbiota colonized B6J and C3H mice (n = 6). Kruskal-Wallis test with Dunn´s multiple comparison test * p < 0.05. Box plot indicates median. Each symbol represents one independent sample. (E–G) Pancreatic digestive enzymes: (E) pancreatic lipase, (F) pancreatic amylase determined by routine clinical chemistry methods in plasma of GF and complex microbiota colonized B6J and C3H mice (n = 6). Kruskal-Wallis test with Dunn´s multiple comparison test ** p < 0.001, * p < 0.05. Box plot indicates median. Each symbol represents one independent sample. (G) Gene expression of Prss2 measured by qPCR in total RNA isolated from the pancreas of GF and complex-microbiota colonized B6J and C3H mice. Relative differences in gene expression were calculated by the comparative 2−ΔΔCt method. Kruskal-Wallis test with Dunn´s multiple comparison test. Box plot indicates median. Each symbol represents one independent sample. (H–K) Luminal levels of digestive enzymes: (H) Luminal trypsin activity of GF and complex microbiota colonized B6J and C3H mice measured by ELISA. Kruskal-Wallis test with Dunn´s multiple comparison test **** p > 0.0001. Box plot indicates median. Each symbol represents one independent sample. (I) Concentration of luminal trypsin measured in cecal content of GF and complex microbiota colonized B6J and C3H mice. Kruskal-Wallis test with Dunn´s multiple comparison test *** p > 0.001, * p > =0.05. Box plot indicates median. Each symbol represents one independent sample. (J) Representative immunostaining for trypsin 2 (green) of colon lumen obtained from GF and complex microbiota colonized B6J and C3H mice (n = 5) including staining negative control (NC). Colon slides were counterstained with DAPI (blue). (K) Concentration of luminal chymotrypsin measured in cecal content of GF and complex microbiota colonized B6J and C3H mice. Kruskal-Wallis test with Dunn´s multiple comparison test *** p > 0.001. Box plot indicates median. Each symbol represents one independent sample.

