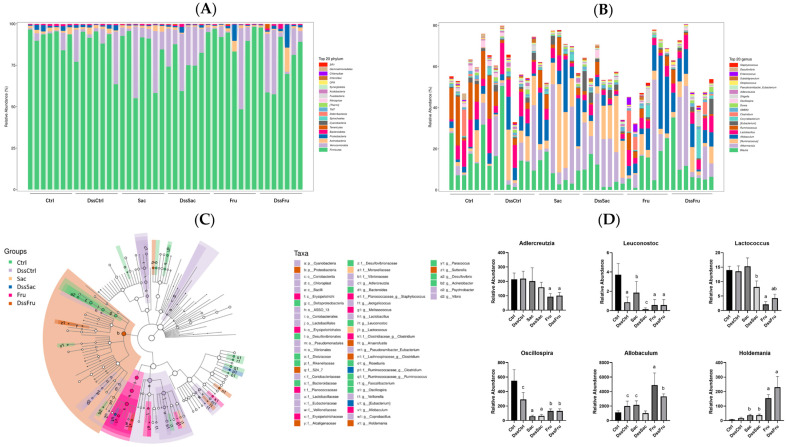
Figure 4.
Alteration of sucrose and fructose on gut bacterial community in rats (n = 7). (A,B) Relative abundance of the fecal microbiota at the phylum and genus level. (C) Cladogram of different groups (LDA > 2). (D) Presentative differential taxa, n = 7. Data represent the following: means ± SEM; different letters indicate significant difference, p ˂ 0.05.

