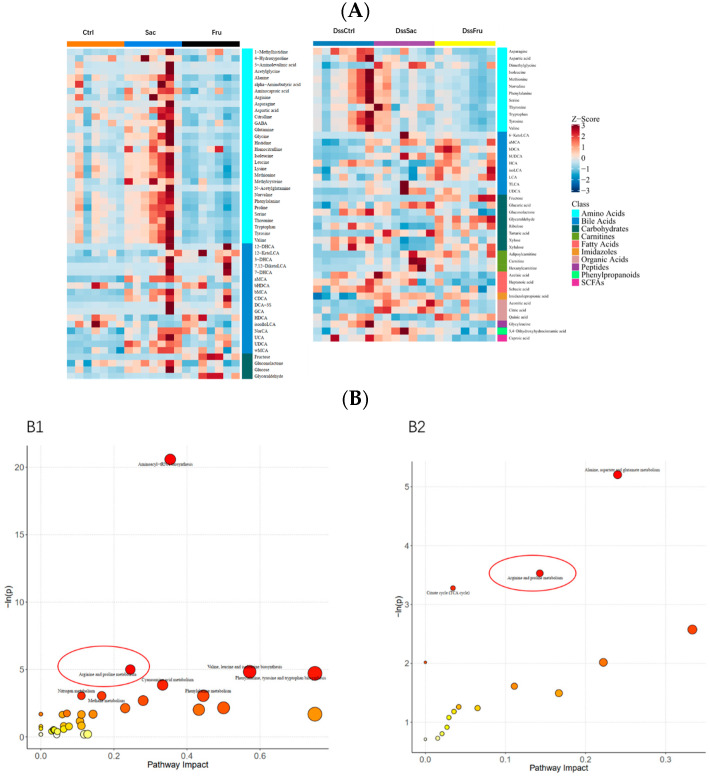
Figure 6.
Sucrose and fructose alter colonic metabolite profiles. (A) Heatmap of sucrose and fructose’s alteration of metabolites; (B) KEGG annotation analysis of the altered metabolites based on the differences between sucrose and fructose; B1 KEGG annotation barplot of Sac vs. Fru; B2 KEGG annotation barplot of DssSac vs. DssFru. The arginine and proline metabolism pathways are highlighted with red circles in the figure.

