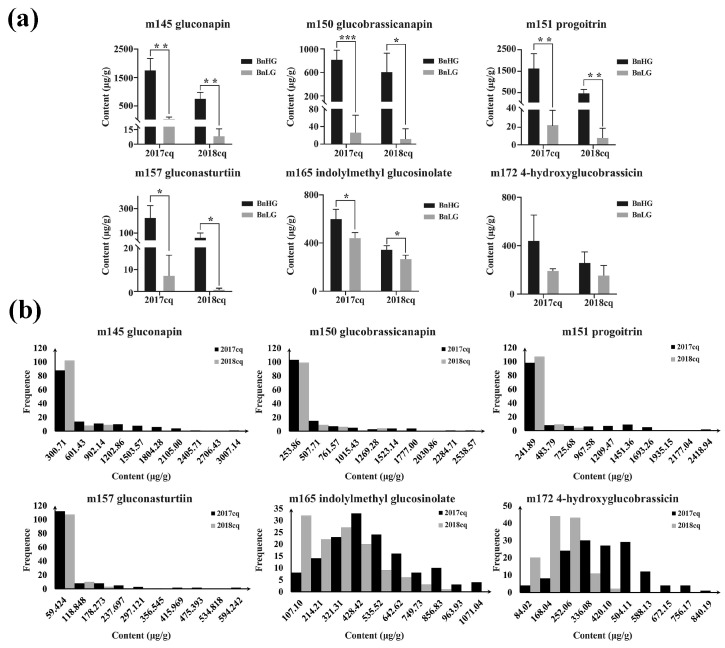
Figure 2.
Variation in the contents of six glucosinolate metabolites in the rapeseed panel in different years (2017cq and 2018cq). (a) Differences in the contents of six glucosinolate metabolites in BnHG and BnLG. Asterisks indicate significant differences (*, p < 0.05; **, p < 0.01; and ***, p < 0.001). (b) Frequency distributions of the six glucosinolate metabolites for 143 rapeseed accessions in the two years (2017cq and 2018cq).

