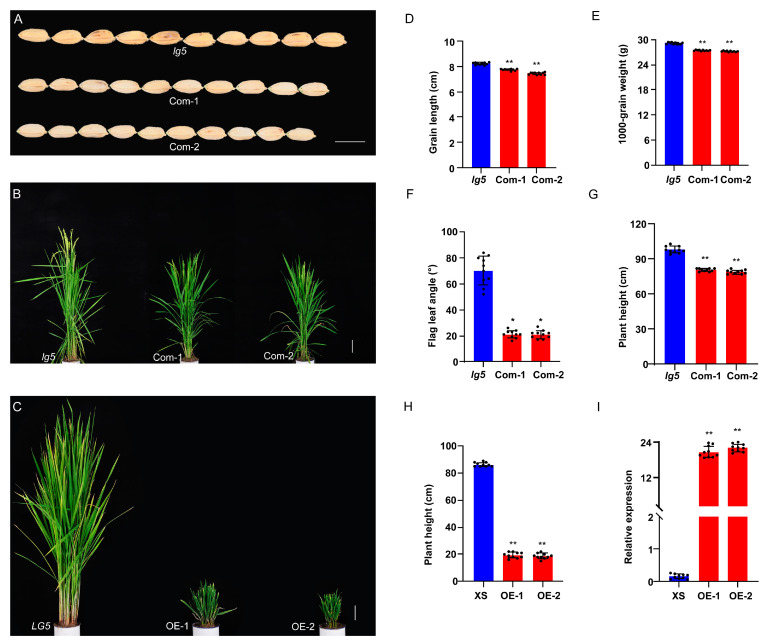
Figure 3.
Complementary test and overexpression (OE) analysis at the mature stage. (A) Grain length of lg5 and Com; bar = 8 mm. (B) Plant height of lg5 and Com; bar = 10 cm. (C) Plant height of XS and OE; bar = 10 cm. (D–G) Grain length, thousand-grain weight, flag leaf angle, and plant height of lg5 and Com. (H) Plant height of XS and OE. (I) Relative expression of LG5 in culms of XS and OE with the rice ACTIN gene used as an internal control. Data are presented as means ± SD. * and ** indicate p < 0.05 and p < 0.01, respectively, according to Student’s t-test.

