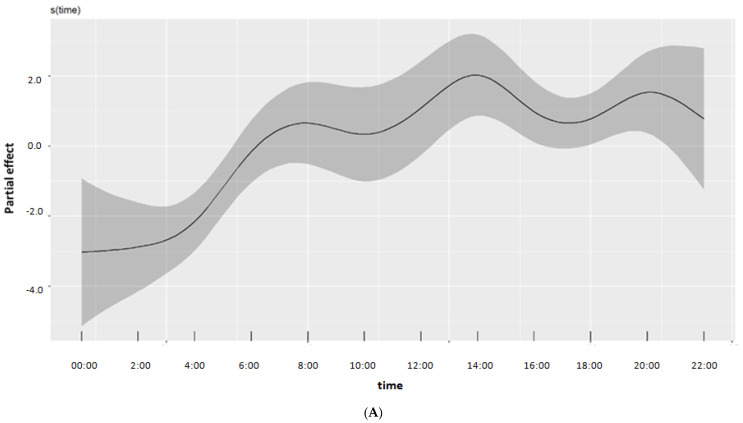
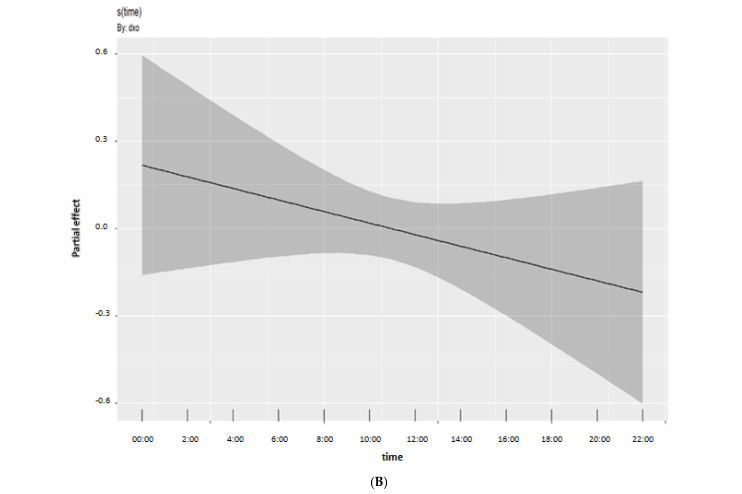
Figure 1.
GAM−estimated smooth functions demonstrating the energy trend during the course of the day for the normal (NCF) cognition category (A), and the deviation of the MCI cognition category from this energy trend (B). Grey-shaded areas represent the respective 95% credible intervals. Energy values are plotted on the linear predictor (log) scale.


