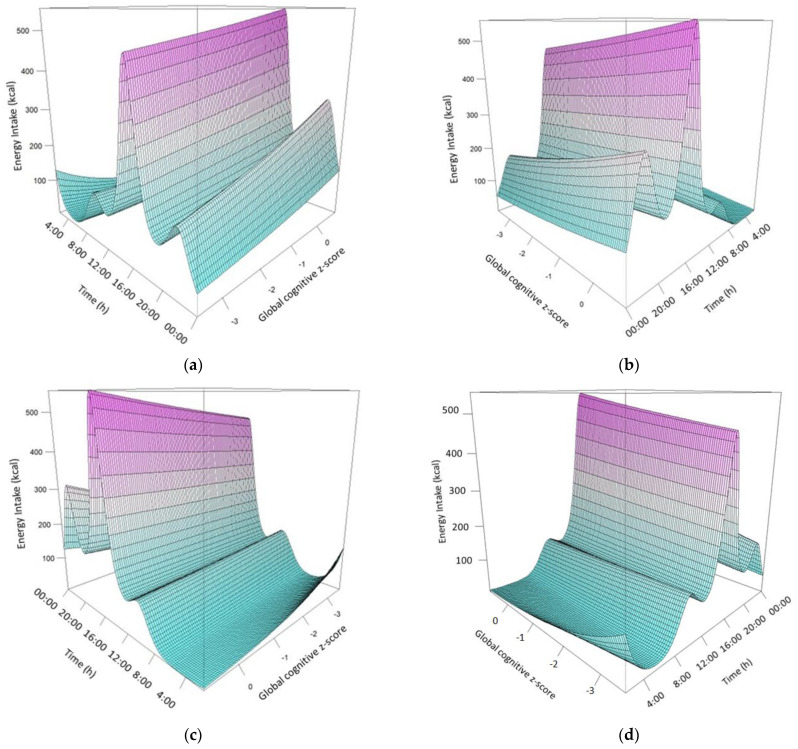
Figure 2.
Multi−angle [(a): 45°, (b): 135°, (c): 225°, (d): 315°] Three-dimensional graphic illustration of daily energy distribution as a function of global cognitive z-score. The plot is derived from an adjusted GAM model with energy intake as the outcome and the tensor product of time with global cognitive z-score as the main predictor.

