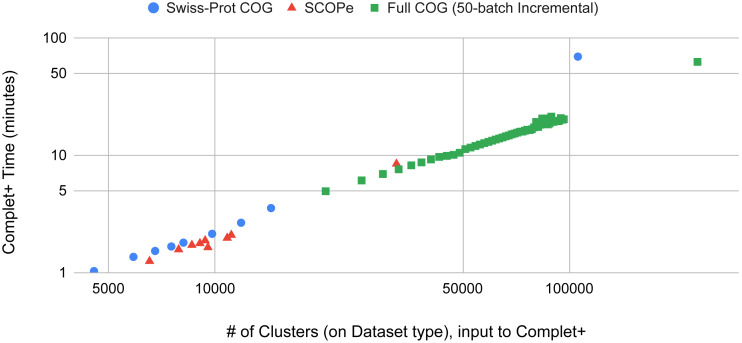
Figure 9. The Complet+ time vs. the number of clusters produced by a variety of algorithm modes in MMseqs2.
Some algorithms deviate from the line on the log–log plot due to the output cluster representatives and the different relationships between them (e.g.: cascaded tends to produce more less similar representatives while linclust produces more similar ones). Using the same type of algorithm on the 50-batch large dataset, Complet+ scales linearly vs. the number of input clusters.

