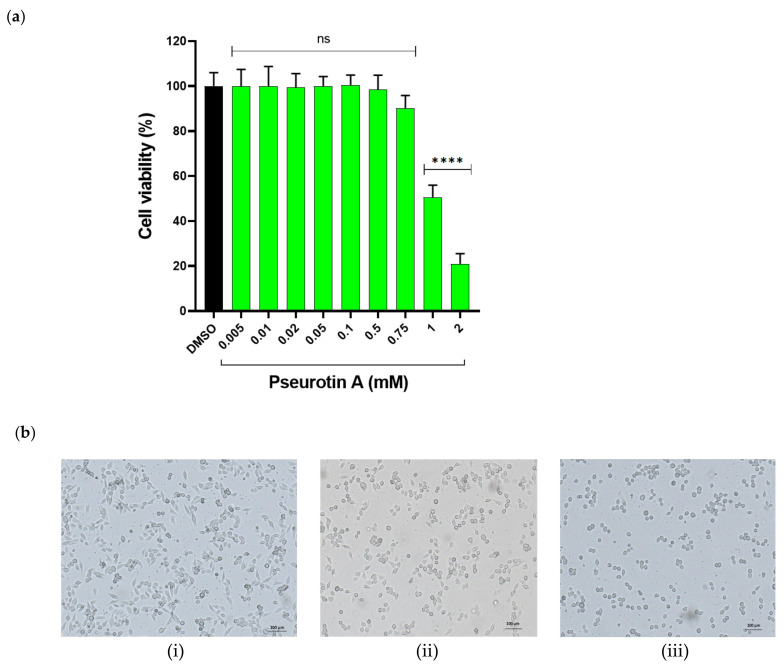
Figure 1.
The effect of PsA treatment on the viability of the human immortalized RWPE-1 prostate epithelial cells determined by the standard MTT protocol. (a) Bar graph shows dose response of cytotoxic effect of PsA after 24 h treatment. (b) Representative images (scale bar embedded) of human immortalized RWPE-1 prostate cells. (i) DMSO treated control cells. (ii) Cells treated with PsA at 1 mM concentration. (iii) Cells treated with PsA at 2 mM level. Data shown as mean ± SD of triplicate wells. **** indicates a statistical significance at p < 0.0001 for specified concentrations versus vehicle-treated control cells. ns indicates non-statistical significance at p < 0.05.

