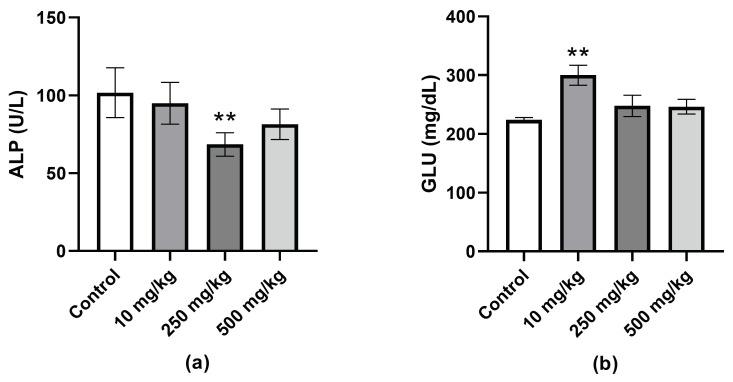
Figure 7.
Comparison of the plasma ALP and glucose levels in PsA versus vehicle control-treated Swiss albino mice. (a) Plasma ALP levels of female Swiss albino mice treated with PsA. (b) Plasma glucose levels of male Swiss albino mice treated with PsA. Data shown as mean ± SEM for n = 5/sex/group. ** indicates a statistical significance at p < 0.01.

