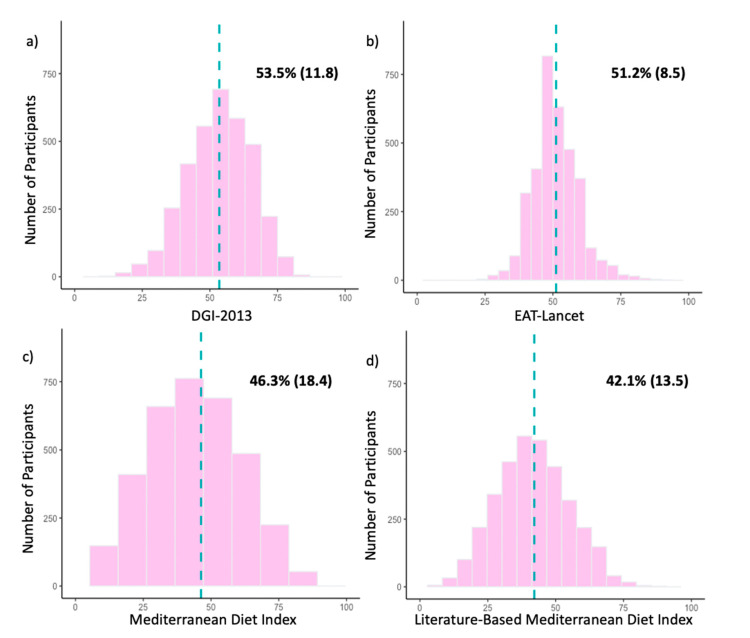
Figure 2.
(a–d). Histograms of participant scores for the (a) Dietary Guideline Index 2013 (DGI-2013), (b) EAT-Lancet Index, (c) Mediterranean Diet Index (MedDiet) and (d) Literature-Based Mediterranean Diet Index (Lit-MedDiet) for the whole study population (n = 3458). For comparison across indices, participant scores are represented as percentages of the maximum possible score for each dietary index. The dotted blue line represents the location of the mean. Mean percentages of participant scores are shown in the upper right-hand area of each histogram, presented as mean (SD).

