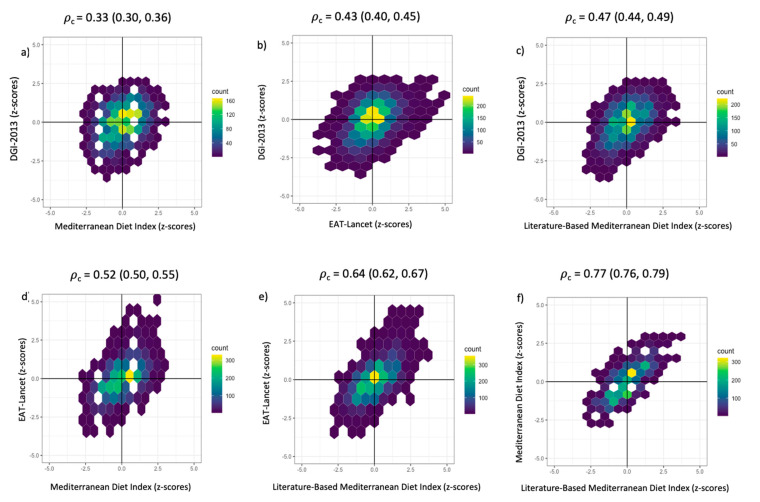
Figure 3.
(a–f). Density hexabin plots with z-scores of the dietary indices: EAT-Lancet Index, Dietary Guideline Index 2013 (DGI-2013), Mediterranean Diet Index (MedDiet) and the Literature-Based Mediterranean Diet Index (Lit-MedDiet). Lin’s concordance correlation coefficient (𝜌c) and 95% confidence intervals were calculated to measure the extent of agreement pairwise between dietary indices.

