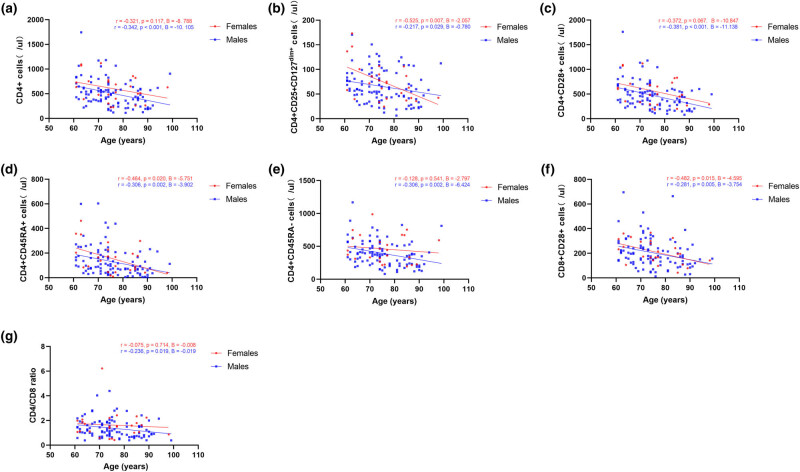
Figure 1.
Correlation analysis between absolute counts of T-cell subsets and age. (a–g) Correlation between age and absolute counts of CD4+ cells, CD4+CD25+CD127dim+ cells, CD4+CD28+ cells, CD4+CD45RA+ cells, CD4+CD45RA− cells, CD8+CD28+ cells, and CD4/CD8 ratio. Red indicates females, and blue indicates males.

