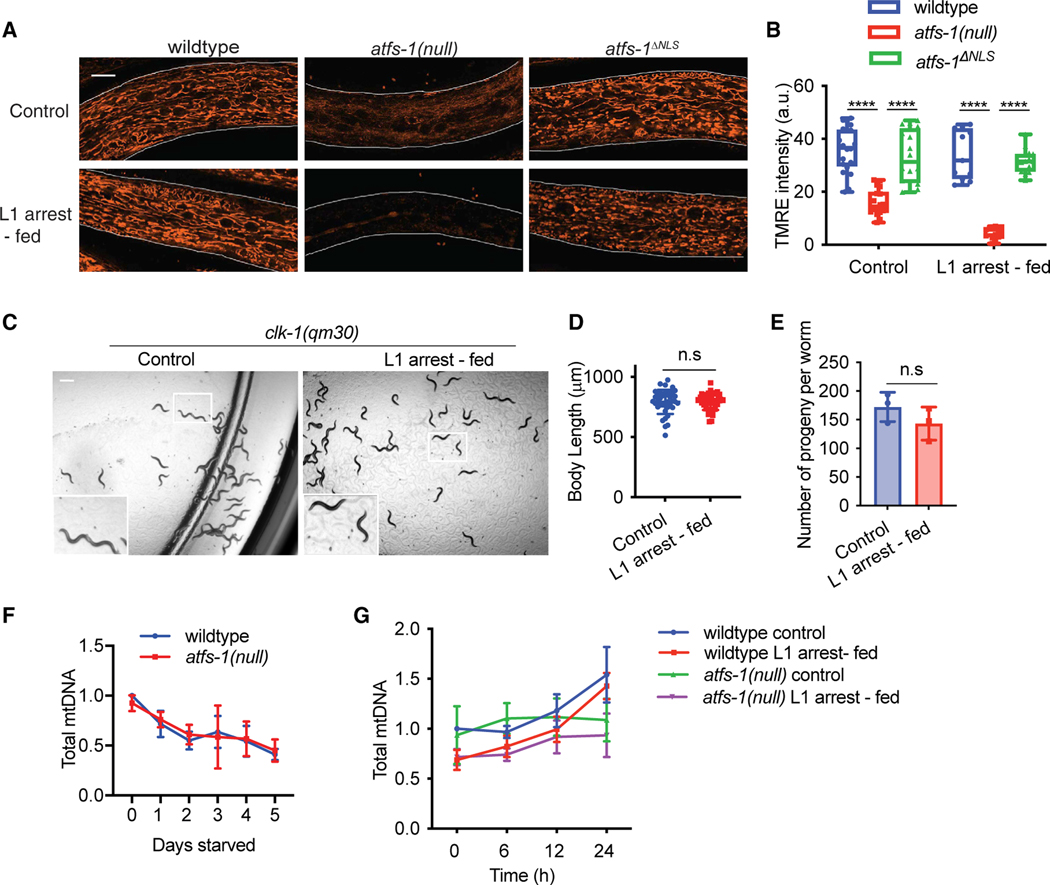
Figure 2. UPRmt promotes mtDNA content recovery after starvation.
(A) Images comparing TMRE staining of wild-type, atfs-1(null), and atfs-1ΔNLS worms under control or L1 arrest-fed conditions, obtained when control worms reached the L4 stage (scale bar, 10 μm; representative images from three biological replicates).
(B) Quantification of TMRE staining of wild-type, atfs-1(null), and atfs-1ΔNLS worms at the L4 stage under control or L1 arrest-fed conditions (n = 15–20 worms for each strain and condition ± SD, ****p < 0.0001, two-way ANOVA with post-hoc Sidak’s test; a.u., arbitrary unit).
(C) Images comparing development of clk-1(qm30) worms under control and L1 arrest-fed conditions on day 1 of adulthood (scale bar, 0.5 mm).
(D) Body length quantification of clk-1(qm30) worms under control and L1 arrest-fed conditions, measured on day 1 of adulthood (n = 3 ± SD, Student’s t test).
(E) Brood size quantification of clk-1(qm30) worms under control and L1 arrest-fed conditions (n = 3 ± SD, 10–15 worms each replicate, Student’s t test).
(F) mtDNA quantification of wild-type and atfs-1(null) starved L1 worms over a period of 5 days as determined by qPCR (n = 3 ± SD, one-way ANOVA; wild-type worms: ***p = 0.0007, post hoc Dunnett’s test shows significant difference between 0-day starved worms and 1- to 5-day starved worms; atfs-1(null) worms: *p = 0.0191, post-hoc Dunnett’s test shows significant difference between 0-day starved worms and 3- to 5-day starved worms).
(G) Time course of mtDNA content quantification over 24 h as determined by qPCR comparing wild-type and atfs-1(null) worms under control and L1 arrest-fed conditions (n = 6 for wild-type and n = 3 for atfs-1(null) ± SD, **p = 0.0039 comparing L1 arrest-fed wild-type and atfs-1(null) mtDNA content after 24 h of feeding, two-way ANOVA with post hoc Tukey’s multiple comparisons test).

