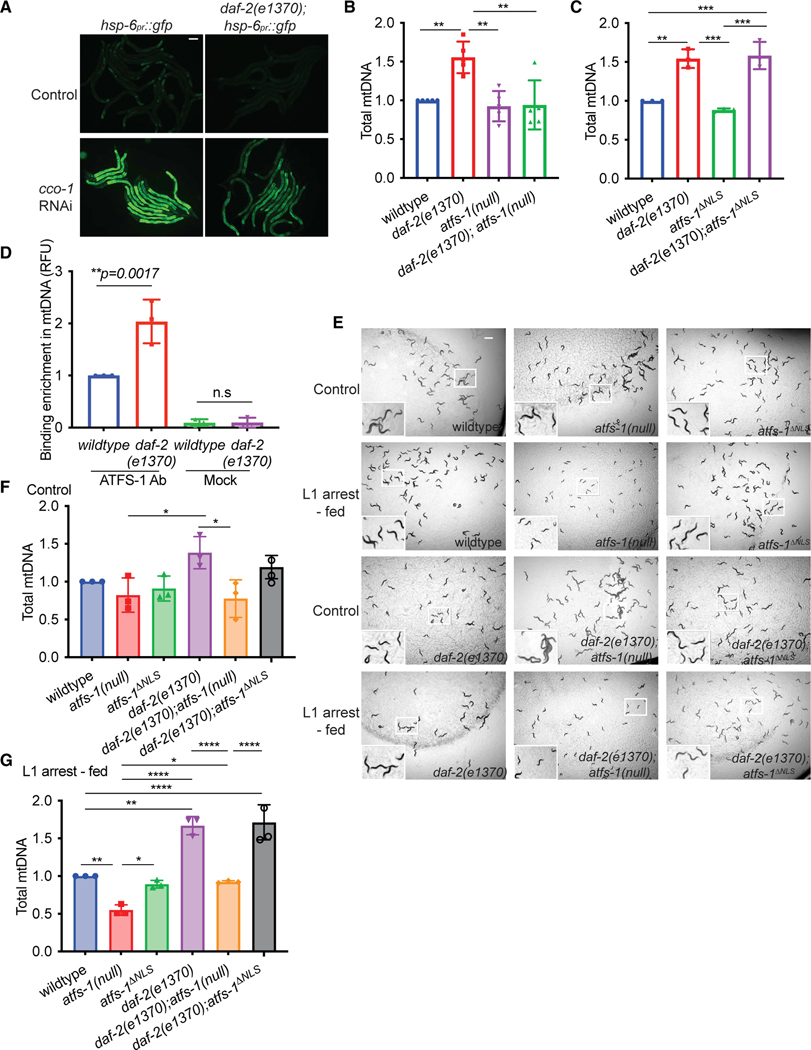
Figure 4. daf-2 inhibition promotes atfs-1-dependent mtDNA replication.
(A) Fluorescence images of hsp-6pr::gfp and daf-2(e1370);hsp-6pr::gfp worms raised on control or cco-1(RNAi) at the L4 stage (scale bar, 0.1 mm).
(B) mtDNA quantification of wild-type, atfs-1(null), daf-2(e1370), and daf-2(e1370);atfs-1(null) worms, determined at the L4 stage (n = 5 ± SD, ****p < 0.0001, one way ANOVA with post hoc Tukey’s multiple comparisons test).
(C) mtDNA quantification of wild-type, atfs-1ΔNLS, daf-2(e1370), and daf-2(e1370);atfs-1DNLS worms determined at the L4 stage (n = 3 ± SD, ****p < 0.0001, one-way ANOVA with post hoc Tukey’s multiple comparison test).
(D) mtDNA quantification after ATFS-1 or control ChIP in wild-type and daf-2(e1370) worms at the L4 stage (n = 3 ± SD, **p = 0.0017, one-way ANOVA with post hoc Tukey’s multiple comparisons test).
(E) Images of wild-type, atfs-1(null), atfs-1ΔNLS, daf-2(e1370), daf-2(e1370);atfs-1(null), and daf-2(e1370);atfs-1ΔNLS worms under control and L1 arrest-fed conditions, obtained when control worms reached the L4 stage (scale bar, 0.5 mm).
(F) mtDNA quantification of wild-type, atfs-1(null), atfs-1ΔNLS, daf-2(e1370), daf-2(e1370);atfs-1(null), and daf-2(e1370);atfs-1ΔNLS worms under control conditions, as determined by qPCR at the L4 stage (n = 3 ± SD, *p = 0.132, one-way ANOVA with post hoc Tukey’s multiple comparisons test).
(G) mtDNA quantification of wild-type, atfs-1(null), atfs-1ΔNLS, daf-2(e1370), daf-2(e1370);atfs-1(null), and daf-2(e1370);atfs-1ΔNLS worms under L1 arrest conditions, as determined by qPCR when control worms reached the L4 stage (n = 3 ± SD, ****p < 0.0001, one-way ANOVA with post hoc Tukey’s multiple comparisons test).

