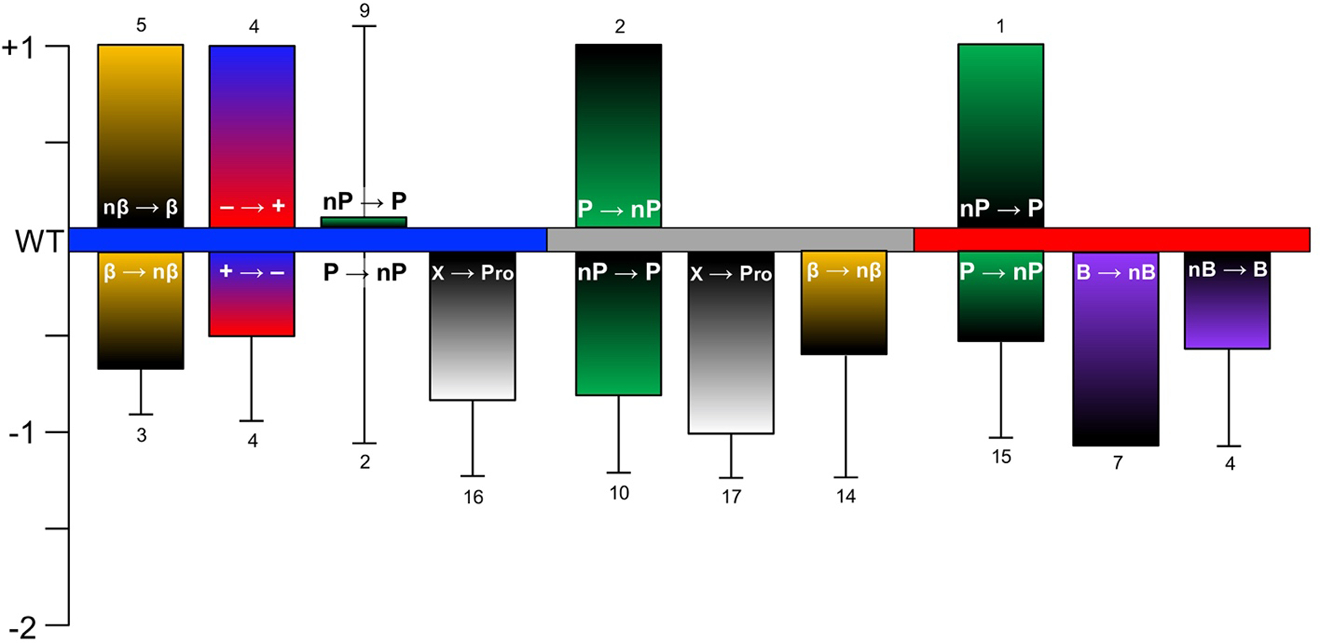
Figure 10.

Categorized Mutation Effects Averaged Over αS Regions. N-Terminal, NAC, and C-terminal regions of αS indicated by blue, grey, and red respectively. Bars depict average aggregation scores for each category, unidirectional error bars represent standard deviation, number of examples given above or below bar. Mutation definitions: nβ→β) non-β-branched to β-branched; β→nβ) β-branched to non-β-branched; – → +) negatively charged to positively charged; + → –) positively charged to negatively charged; nP→P) non-polar to polar; P→nP) polar to non-polar; Pro→X) proline to any other amino acid; X→Pro) any amino acid to proline; nB→B) non-bulky to bulky; B→nB) bulky to non-bulky; Cntrl) control groups represent mutation to the same type of amino acid. Category definitions: β) Ile, Thr, Val; nβ) all others except Gly and Pro; +) Arg, His, Lys; –) Asp, Glu; nP) Ala, Ile, Leu, Met, Phe, Trp, Val; P) all others except Gly and Pro; X) all others except Pro; B) His, Ile, Leu, Phe, Thr, Trp, Tyr, Val; nB) all others except Pro.
