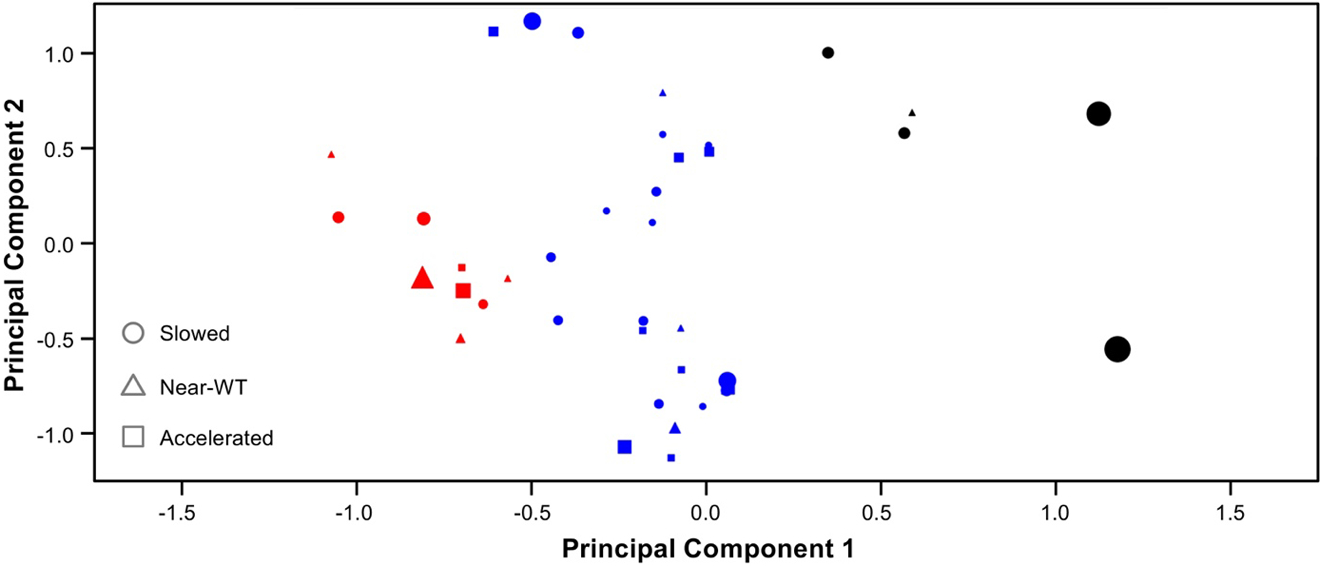
Figure 11.

Two Dimensional Principal Component Analysis (PCA) of K-means Clustered Aggregation Data. Circle, triangular, and square markers represent mutations which slow aggregation rate, have no effect (near-WT), or accelerate aggregation rate, respectively. The color of each marker represents the cluster assignment from K-means where red is Cluster 1, blue is Cluster 2, and black is Cluster 3. Since mutants may have exactly the same bit vector representation, (e.g., two Val-to-Pro mutations in the N-terminus with aggregation score −1) many data points overlap in PCA space. Marker size is used to indicate the number of data points at that position in PCA space.
