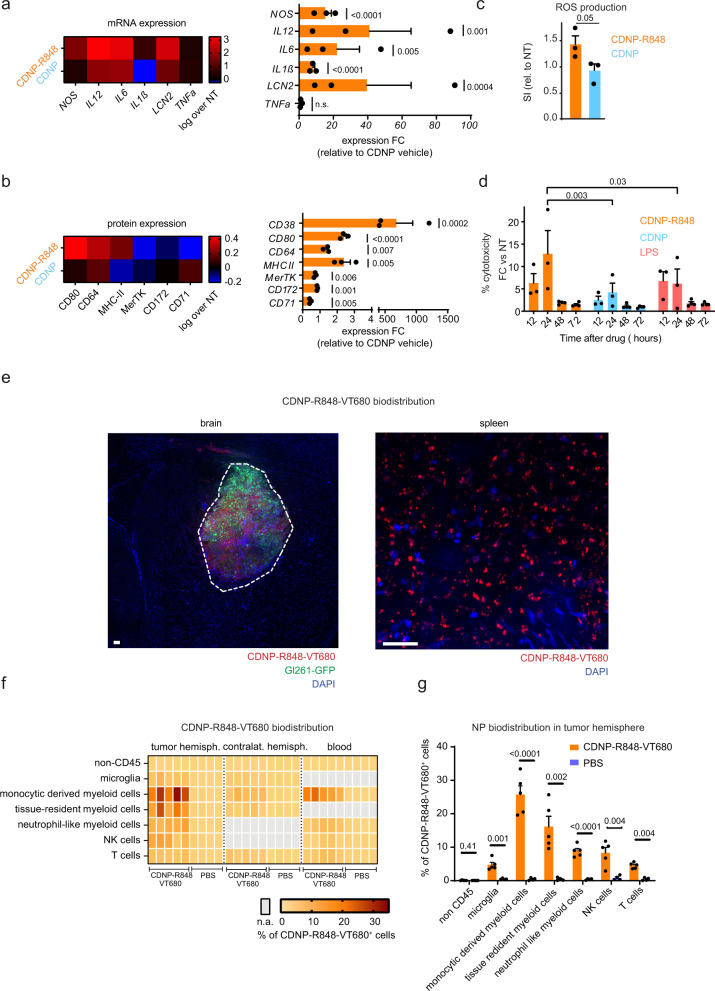
Fig. 1. CDNP-R848 selectively targets macrophages and shifts them towards a pro-inflammatory phenotype.
a mRNA expression profiling by qRT-PCR in bone marrow-derived macrophages (BMDMs) after 1 µM CDNP-R848 or CDNP vehicle treatment Expression of Nos2, Il-6, tnfα, Il-1ß, lcn2 and Il-12 was assessed. (a–c: n = 3 BMDM cultures per group from three mice). b Protein expression profiling by flow cytometry in BMDMs after CDNP-R848 or CDNP vehicle treatment. Quantification of CD80, CD64 and CD38, CD71, CD172, and MerTK. Results are normalized to non-treated cells (NT) BMDMs. c Quantification of ROS production in BMDMs 24 h after CDNP-R848 (1 µM) or CDNP vehicle treatment as measured by flow cytometry after incubation with the probe CellROX Green. Non-treated (NT) cells served as negative control. d Gl261 glioma cells were co-cultured with BMDMs upon CDNP-R848, CDNP vehicle or LPS treatment. Cytotoxicity was quantified by LDH release. Values are corrected for spontaneous effector and target cell LDH release. n = 3 to 4 BMDM cultures per group from three to four mice per time point. e Representative histological image from three biological replicates (n = 3 mice) shows NP accumulation in the TME of Gl261 glioma but not in the adjacent healthy brain. Dashed line indicates glioma border. Micrograph of whole-mounted spleen shows NP uptake in splenic phagocytes. Scale bar is 100 µm. f, g Biodistribution analysis of CDNP-R848-VT680 within myeloid cells 24 h after a single, intravenous dose as assessed by flow cytometry of monocyte-derived myeloid cells (CD45+ CD11bhigh, Ly6c+), tissue-resident myeloid cells (CD45+ CD11bhigh, F4/80+), neutrophil like myeloid cells (CD45+ CD11bhigh, CD11chigh), NK cells (NK1.1+), T-cells (CD3+) and microglia (CD45+ CD11bintermediate) in the tumor-bearing hemisphere, contralateral hemisphere and blood. n = 5 CDNP-R848-VT680 mice and 4 PBS-treated animals. Data are representative of two independent experiments and presented as mean ± SEM. Statistical significance was determined by two-way ANOVA with Sidak’s test. n.a.: not applicable. NT: non-treated. FC: fold change.

