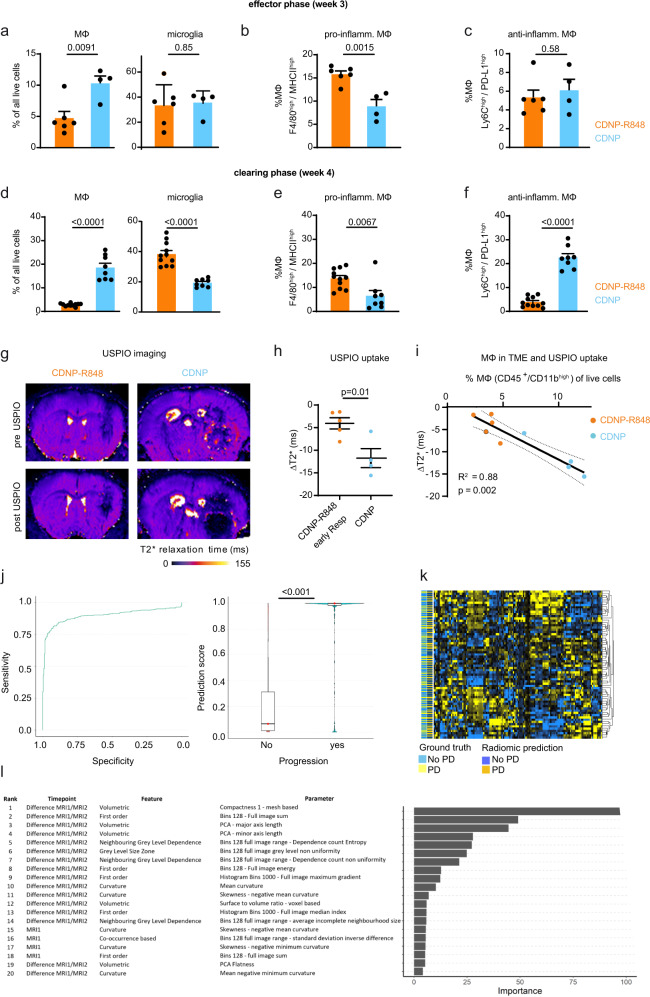
Fig. 5. Macrophage- and radiomics-based multiparametric MRI signatures of CDNP-R848 therapy response.
a Quantification of macrophages (CD45+, CD11bhigh) and microglia (CD45+, CD11bint) in the effector phase (week 3, d21); b Quantification of MHC-II and c: PD-L1 on TAMs and MDSCs in the effector phase (a–c: n = 6 mice for CDNP-R848; n = 4 mice for CDNP, one independent experiment) d Quantification of macrophages/microglia; and e: MHC-II and f: PD-L1 on macrophages in the tumor-clearing phase (week 4, day 28; d–f: n = 11 mice for CDNP-R848 and n = 8 mice for CDNP, pooled data from two independent experiments). g Representative magnetic gradient echo (MGE) maps before and 24 h after USPIO administration (ferumoxytol, 30 mg/kg, representative images from 9 independent mice). USPIO imaging was performed on d20 after completion of treatment. h Quantification of USPIO accumulation in CDNP-R848 early responder mice vs CDNP vehicle-treated animals (CDNP-R848, n = 5 mice; CDNP, n = 4 mice, one independent experiment). i Correlation analysis of Δ T2* relaxation time and macrophage influx as quantified by flow cytometry in CDNP-R848 responder mice vs CDNP vehicle-treated animals on d21. (CDNP-R848; n = 5 vs CDNP; n = 4 mice from one independent experiment). j Radiomic signature prediction score across the datasets for predicting treatment response based on radiomic features of MRI1 (baseline, week 2) and MRI2 (week 3 after completion of the therapy cycle). ROC curve for the performance of the developed gradient boosting model. (n = 66 animals with 3 MRI datasets each from 5 independent experiments). Boxplot with blocks showing the interquartile range (IQR) of data points and the horizontal central line (red dot) corresponds to the median. The superimposed violin plot visualizes the distribution of the data and its probability density. k Heatmap of radiomic features. l Top predictive radiomic features for the developed model. The data are presented as mean ± SEM. Statistical significance was determined for two groups by two-tailed Student’s t tests or by one-way ANOVA for multiple group comparisons. Correlation analysis was performed by Spearman correlation.

