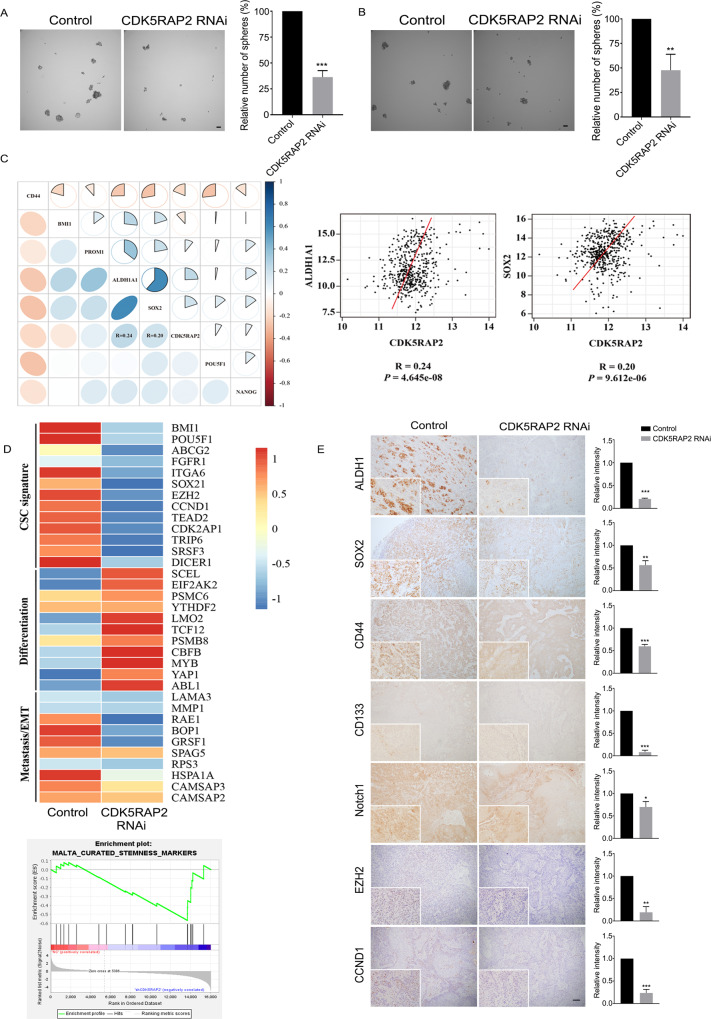
Fig. 5. CDK5RAP2 knockdown suppresses stemness of OSCC cells.
A, B Equal numbers of control and CDK5RAP2-knockdown stable Cal27 cells A or HSC-3 cells B were seeded into ultra-low-attachment plates and incubated for 8 days, after which the spheres (diameter > 50 μm) were counted. Scale bars, 50 μm. C Correlation between CDK5RAP2 and HNSCC CSC markers. D Heatmap presenting gene-expression profiles of control and stable CDK5RAP2-knockdown cells. Gene expression was measured using RNA-sequencing, and GSEA was performed. E Control and stable CDK5RAP2-knockdown cells were inoculated subcutaneously into nude mice. The panel shows representative images of tumor sections stained with antibodies against ALDH1, SOX2, CD44, CD133, Notch1, EZH2, and CCND1. Image J was used to analyze the relative expression intensities of indicated CSC markers from isolated xenograft tumors. Scale bar, 100 μm. All data are presented as means ± SD; *P < 0.05, **P < 0.01, ***P < 0.001, two-tailed Student’s t-test.

