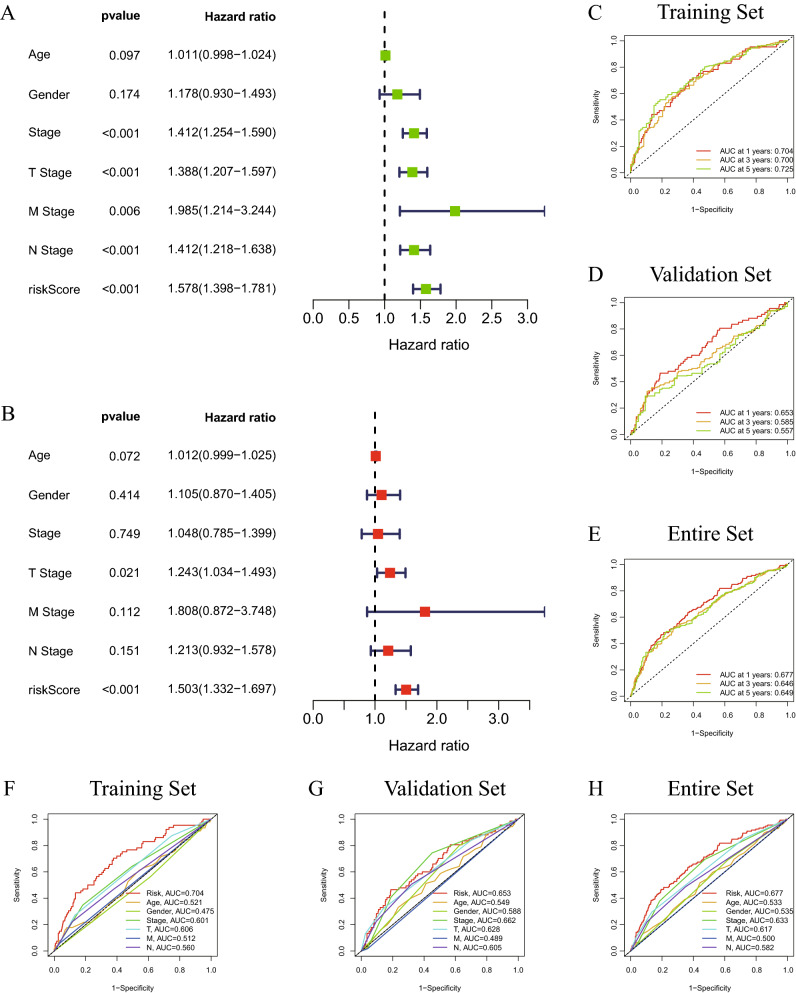
Figure 4.
Forest diagrams of univariate (A) and multivariate (B) Cox regression analyses illustrate that the risk score is an independent prognostic factor in lung cancer. The ROC curves of the 1-year, 2-year and 5-year survival rate in the training set (C), validation set (D) and entire set (E). The ROC curves of the risk score, age, sex, stage, T stage, N stage and M stage in the training set (F), validation set (G) and entire set (H). ROC, receiver operating characteristic.

