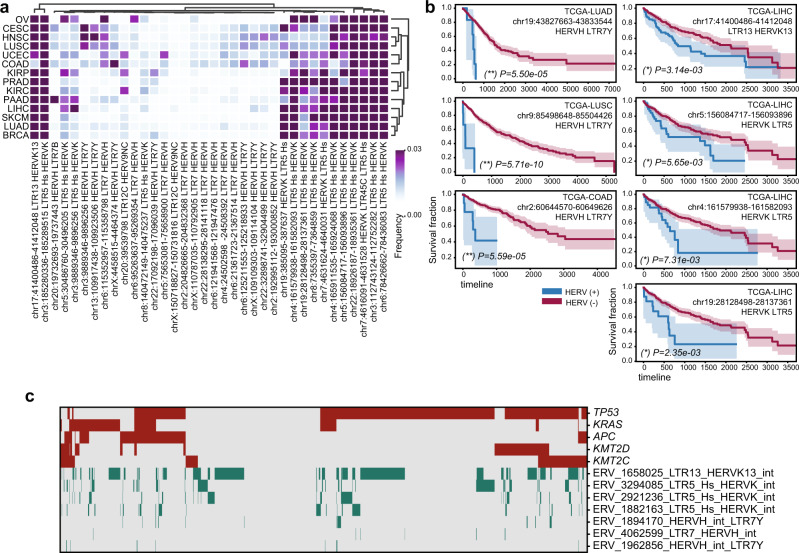
Fig. 3. Human endogenous retroviruses (HERVs) expressed in different cancer types.
a Heatmap clustogram clustering the proportion of HERVs across different tumor types. The rows are 14 TCGA tumor types. The 36 columns are the 36 distinct HERVs with the highest expression in human cancers, mapped to unique regions in the genome (Supplementary Data 5). b Selection of Kaplan–Meier curves comparing the survival rates between patients in which any HERV reads were detected (blue curves) versus those in which no HERV reads were detected (red curves). The unadjusted two-sided log-rank p values are reported. (**) global FDR q < 0.05, (*) cancer-type specific FDR q < 0.05. For Kaplan–Meier curves, shaded areas represent the confidence interval of survival. Additional significant associations between HERV and survival are reported in Supplementary Data 12. c Heatmap showing somatic mutations in major cancer driver genes (selected are the most frequently mutated driver genes in these samples, red) and the expression of HERVs that are significantly associated with survival in LIHC, LUAD, LUSC, and COAD (green). Source data are provided as a Source Data file 3.

