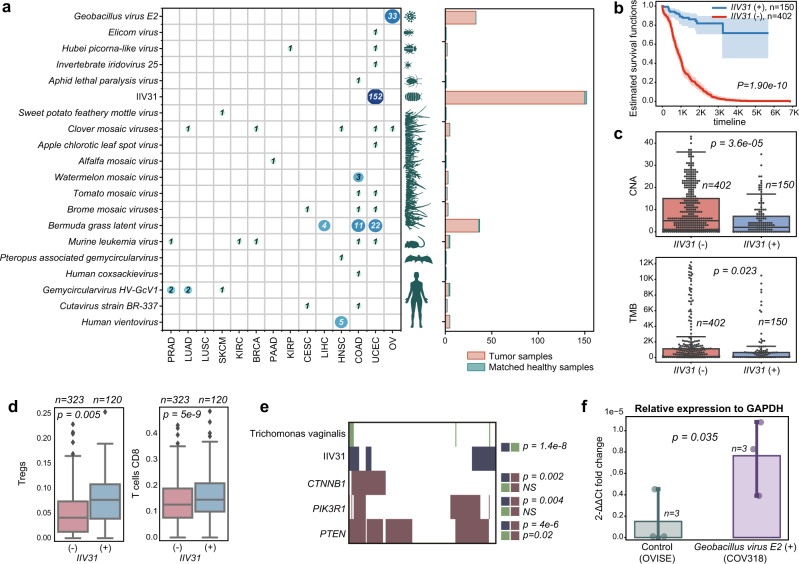
Fig. 4. Unexpected and divergent viruses infecting different host taxa across TCGA samples.
a Unexpected and divergent viruses expressed in TCGA samples. Each row in the matrix represents one virus and the entry in each column indicates the number of cancer samples of each type in which each virus was detected. The canonical hosts of each virus are depicted at the left of the matrix. At right, the aggregate number of tumor and normal samples containing reads of each virus are shown in a bar plot. b Kaplan–Meier curves comparing the survival rates between patients in which IIV31 reads were detected (blue curves) vs those where viral reads were not detected (red curves). For Kaplan–Meier curves, shaded areas represent the confidence interval of survival. The log-rank p value is reported. c Box plots comparing the chromosome-level copy number alteration (CNA, top panel) and the tumor mutation burden (TMB, bottom panel) between cancer patients where IIV31 is found (blue) and patients where IIV31 is not found (red). Two-sided Wilcoxon rank-sum p value is reported. d Box plots comparing CIBERSORT-inferred proportions of regulatory T cells (Tregs) and CD8 T cells between patients positive and negative for IIV31. Boxes show the quartiles (0.25 and 0.75) of the data, center lines show the medians, and whiskers show the rest of the distribution except for outliers. A two-sided Wilcoxon rank-sum p value is reported for comparisons assigned with FDR q < 0.05. e Trichomonas vaginalis and somatic mutations in PTEN, CTNNB1, and PIK3R1 are associated with IIV31 presence. One-sided Fisher’s exact test p values are provided. f Bar plot comparing the fold change (relative to GAPDH) between the COV318 cell line that was predicted as Geobacillus-positive, and the OVISE cell line that was used as control. Error bars show the standard deviation. The one-sided t-test p value is provided. Source data are provided as a Source Data file 4.

