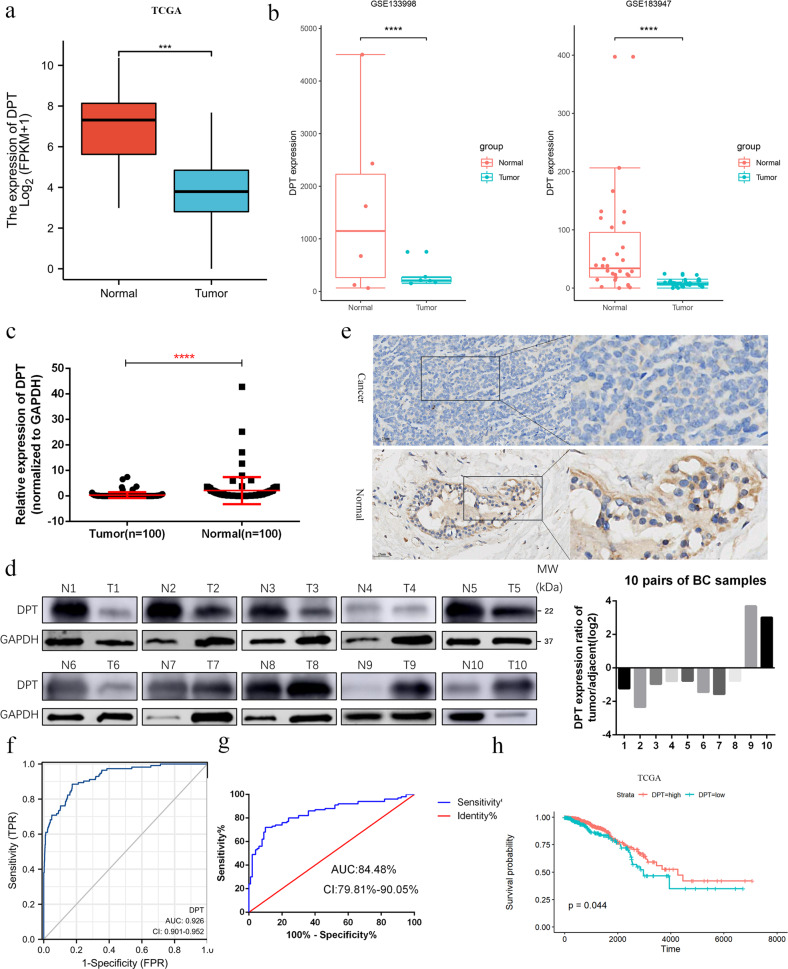
Fig. 1. Low expression of DPT in BCs predicts a poor prognosis.
a Expression levels of DPT in BC and normal breast tissues from The Cancer Genome Atlas (TCGA) database. b Expression of DPT in the GSE133998 and GSE183947 BC cohorts. c Quantitative RT-PCR analysis of DPT mRNA expression in 100 paired BC tissues and non-cancerous tissues. d Representative western blotting analysis showed DPT expression in ten pairs of human BC tissues and adjacent nontumorous tissues and their grayscale analysis were conducted. e Representative IHC staining image of DPT in paired BC tissues and non-cancerous tissues. f ROC curve for DPT expression to diagnose BC in the TCGA cohort. g ROC curve for DPT expression to diagnose BC in 100 breast cancer patients. h OS analysis of DPT expression in BC patients. ***P < 0.001, ****P < 0.0001. All experiments were repeated three times.

