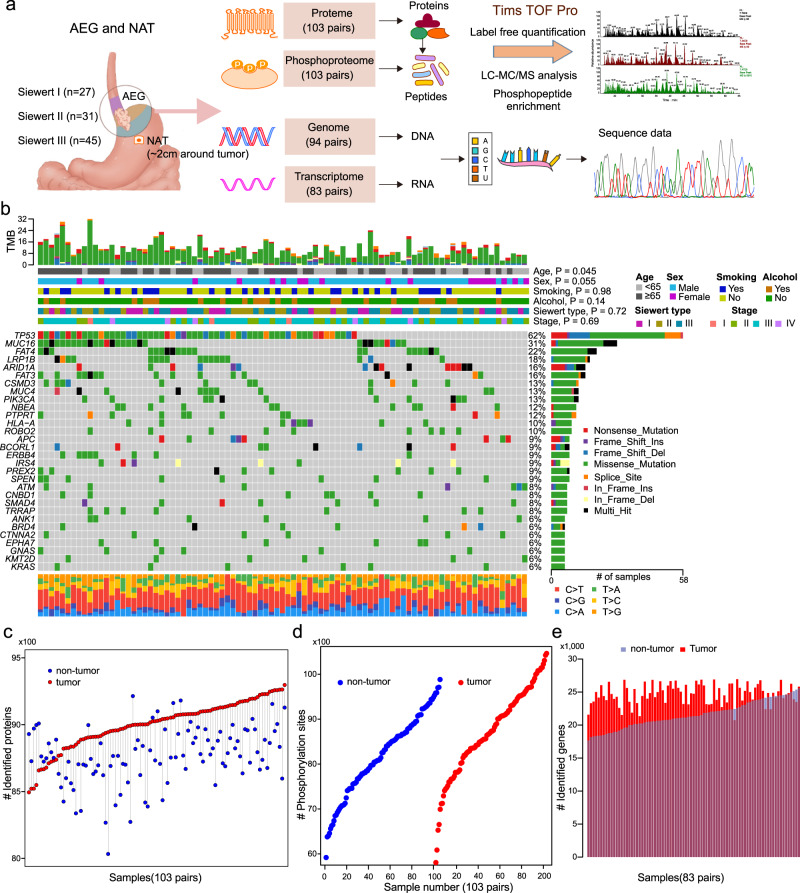
Fig. 1. Multi-omics landscape of adenocarcinoma of the esophagogastric junction (AEG).
a Schematic overview of the experimental design and data acquisition process for proteomics, phosphoproteomics, WES, and RNA-seq. NAT indicates normal adjacent tissue. b The genomic profiles of AEG patients. The top panel shows the tumor mutation burden (TMB) in each patient. The top bars show the clinicopathological features of AEG patients. The middle panel is the oncoplot generated with maftools depicting the top 30 mutated cancer-related genes in the present AEG cohort. The bottom panel shows the proportion of different types of nucleotide substitutions in each patient. The right panel represents mutation types and frequencies for each gene. P, two-sided Wilcoxon’s rank test for age, sex, smoking, and alcohol, and Kruskal–Wallis rank sum test for Siewert type and tumor stages. c Overview of the proteomics profile in 103 AEG patients. d Overview of the phosphoproteomics profile of 206 samples from 103 AEG patients. e Overview of the RNA-seq profile of 83 tumors and paired NAT samples.

