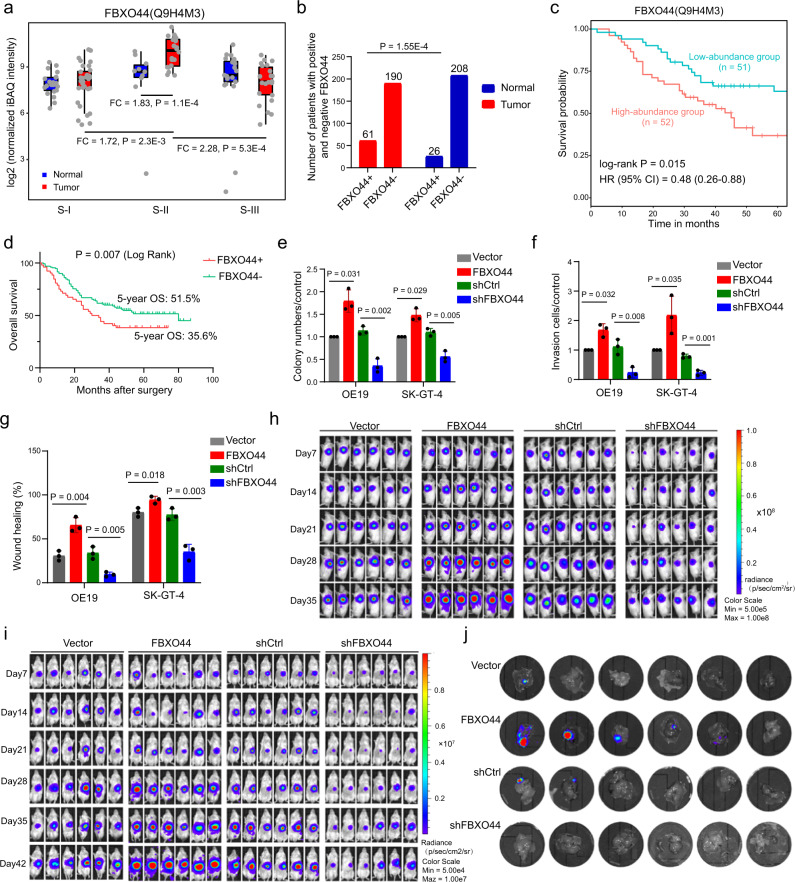
Fig. 4. Clinical relevance and biological functions of FBXO44.
a Comparison of FBXO44 protein abundance between tumor and NAT samples in each subtype and tumors from different subtypes. FC indicates fold change (n = 40 for S-I, n = 23 for S-II, n = 40 for S-III). Each box represents the IQR and median of normalized protein abundance in normal or tumor samples of each subtype, whiskers indicate 1.5 times IQR. P, two-sided Wilcoxon’s rank-sum test. b The distribution of FBXO44 in an independent cohort of tumor and NAT samples from 251 AEG patients. P, chi-squared test. c Kaplan–Meier survival curve comparing FBXO44-high (n = 52) and -low (n = 51) abundance patients. P, log-rank test. d Kaplan–Meier survival curve of FBXO44 in an independent clinical cohort (n = 61 for FBXO44+, n = 190 for FBXO44−). P, log-rank test. e Cell proliferation assays of FBXO44 OE or KD OE19 and SK-GT-4 cell lines (n = 3 biological replicates). P, two-sided Student’s t test. f Transwell invasion assays of FBXO44 OE or KD OE19 and SK-GT-4 cell lines (n = 3 biological replicates). P, two-sided Student’s t test. g Cell migration assays of FBXO44 OE or KD OE19 and SK-GT-4 cell lines (n = 3 biological replicates). P, two-sided Student’s t test. h Representative bioluminescent images of mice bearing OE19 xenograft tumors harboring FBXO44 OE or FBXO44 KD or their corresponding controls at different time points after injection. i Representative bioluminescent images of mice bearing orthotopic OE19 tumors harboring FBXO44 OE or FBXO44 KD or their corresponding controls at different time points post implantation. j Representative images of liver metastasis in mice bearing orthotopic OE19 tumors. In e–g, error bars represent mean ± SDs.

