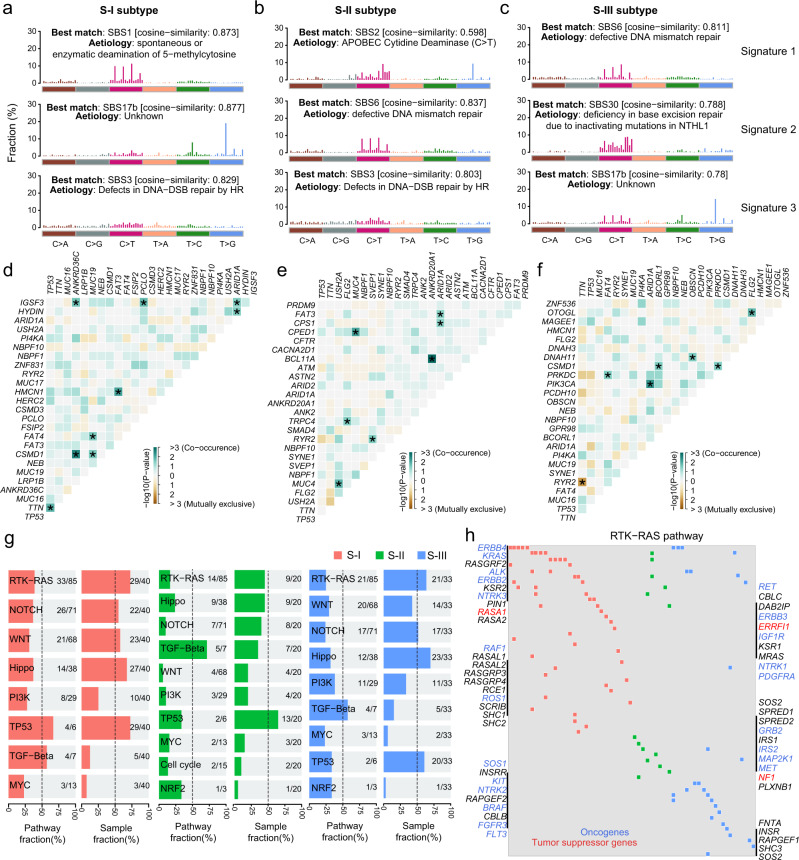
Fig. 5. Comparisons of genomic features among the three proteomic subtypes.
Mutation signatures and the best match SBS signatures in the S-I (a), S-II (b), and S-III (c) subtypes. Somatic interactions of the top mutated genes in the S-I (d), S-II (e), and S-III (f) subtypes. Asterisks indicate statistical significance (Fisher’s exact test). g Fractions of affected pathways and samples by gene mutations in major oncogenic pathways. h Oncoplot of the RTK-RAS pathway in the three subtypes. Red font indicates tumor suppressor genes and blue font represents oncogenes.

