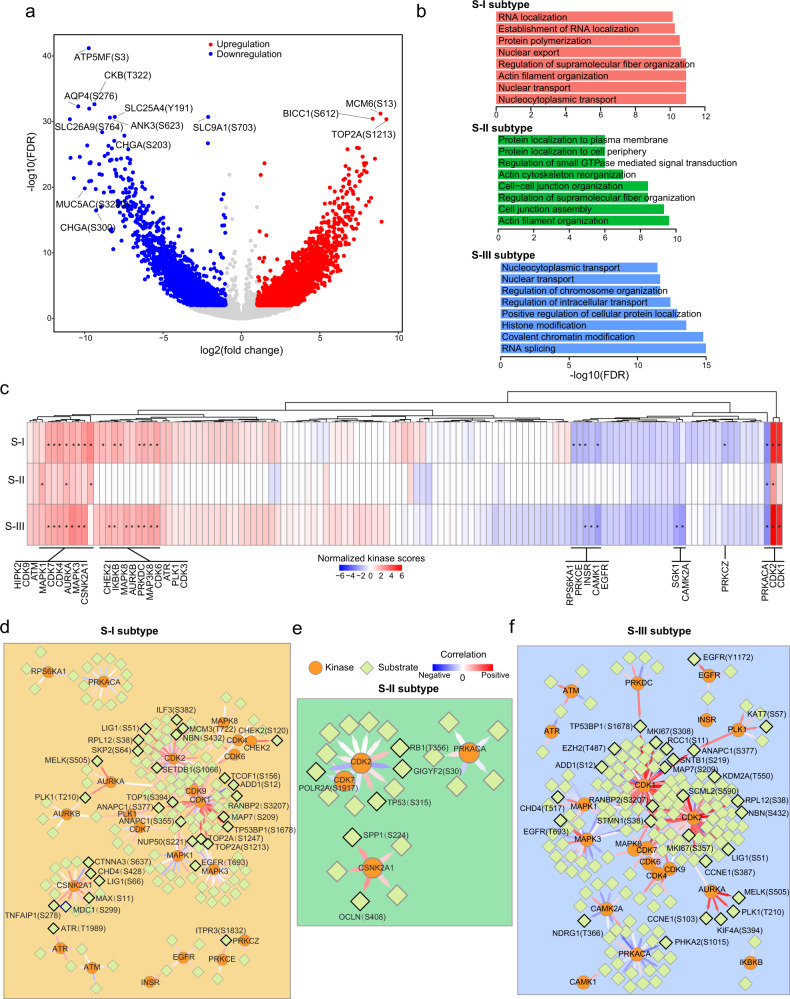
Fig. 7. Phosphoproteomic analyses in three AEG subtypes.
a Volcano plot showing the differential significance of phosphorylation sites. Red circles represent sites with increased phosphorylation (FDR < 0.01 and log2(fold change) > 1) and blue circles indicate downregulated phosphorylation sites (FDR < 0.01 and log2(fold change) < −1). b Enriched biological processes of differentially phosphorylated sites in each subtype. c Kinase enrichment of differentially phosphorylated sites in each AEG tumor subtype. P, Fisher’s exact test. Asterisks (*) represent statistical significance (P < 0.05). Kinase-phosphosubstrate regulatory networks in tumors of the S-I (d), S-II (e), and S-III (f) subtypes.

