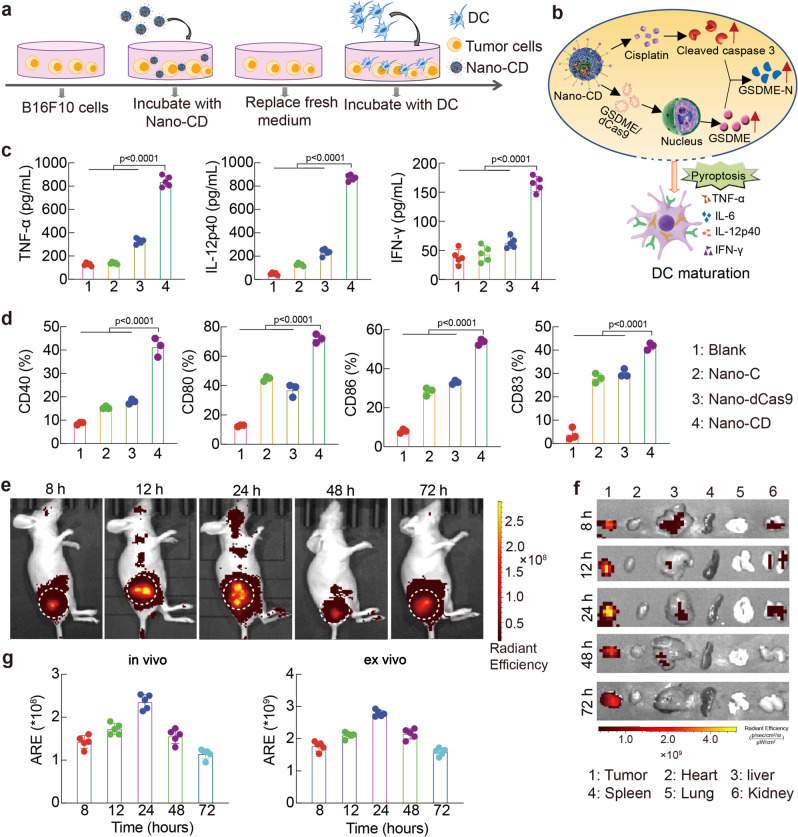
Fig. 4. Immune stimulation of DC by Nano-CD in vitro.
a Illustration of the experimental procedure in vitro. b The mechanism illustration of DC maturation. c, ELISA assay for TNF-α, IL-12p40 and IFN-γ proinflammatory cytokines (n = 4 biological replicates per group). d Profile of DC maturation by FCM (n = 3 biological replicates per group). e–g Real-time in vivo and ex vivo IVIS imaging of Nano-CD after intravenously post i.v. injection of Nano-CD at 8 h, 12 h, 24 h, 48 h and 72 h. The fluorescence intensity of tumor tissues was also quantified. Data are presented as the mean ± s.d. (n = 5 biological replicates per group). In panels c, d, and g, data are presented as the mean ± s.d. and statistically analyzed using one-way ANOVA and Tukey’s tests.

