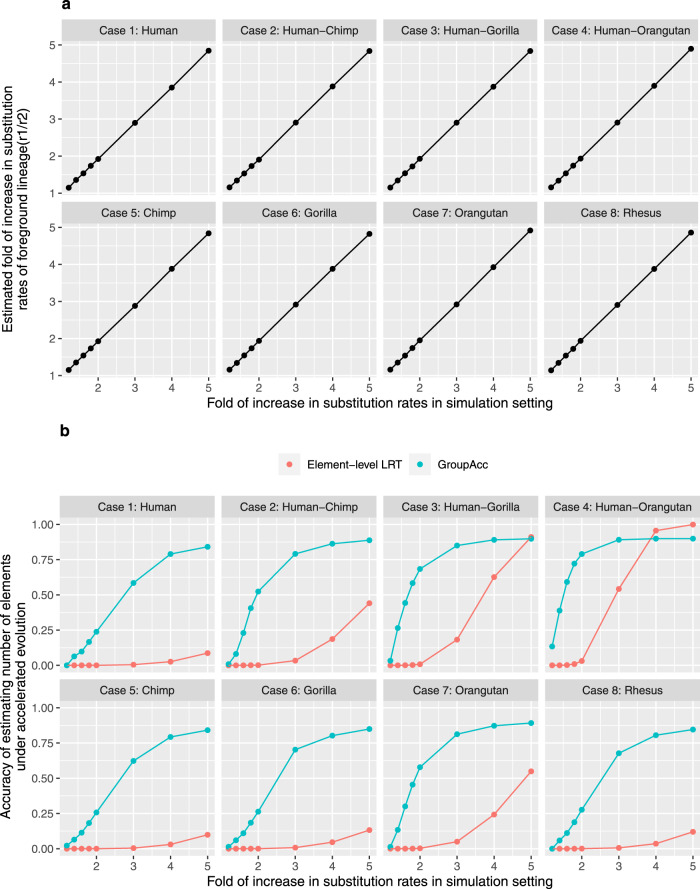
Fig. 2. Simulation results of scenario 1 with foreground lineage matching the accelerated lineage in each case (1–8).
a X-axis shows the scaling factor of foreground lineage branch length in simulation setting, which is the real fold of increase in the substitution rate of the foreground lineage. Y-axis shows the fold of increase in the substitution rate of the foreground lineage estimated from group-level LRT. b Comparison of accuracy estimating the number of elements under accelerated evolution between GroupAcc and element-level LRT method. Blue curves are the accuracy of GroupAcc. Red curves are the accuracy of element-level LRT.

