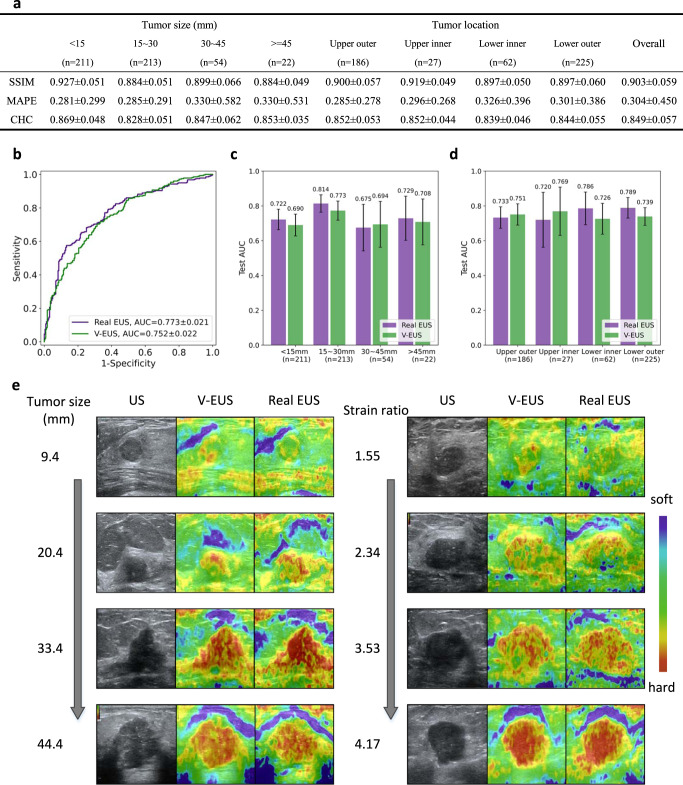
Fig. 2. Performance of the deep learning model on the internal validation set.
a Detailed quantitative metrics comparison stratified by tumor size and tumor location. b Comparison of ROCs between real EUS and V-EUS in determining breast tumor malignancy. c Comparison of diagnostic performance stratified by tumor size. n indicates the number of cases in the interval. Error bar indicates 95% confidence intervals of AUC. d Comparison of diagnostic performance stratified by tumor location. n indicates the number of cases in the interval. Error bar indicates 95% confidence intervals of AUC. e Results of several examples. Source data are provided as a Source Data file.

