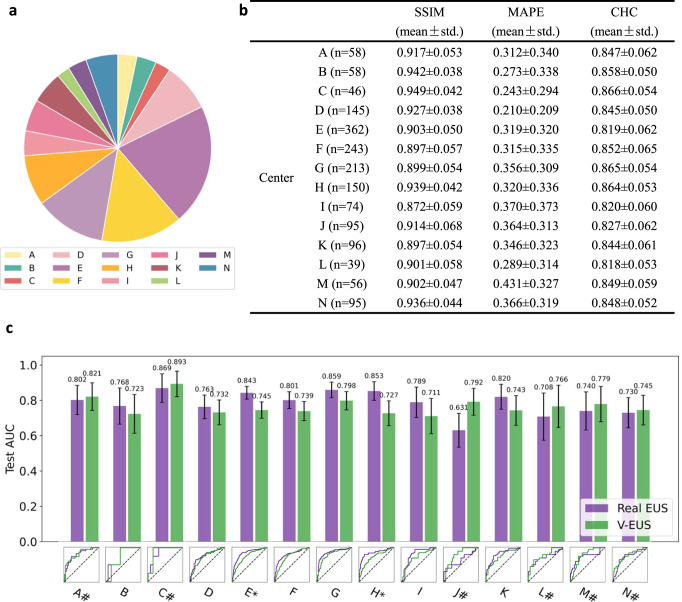
Fig. 3. Adaptability to external multi-center external test cohorts.
a Number of cases comparison of multi-center external test cohort. b SSIM, MAPE and CHC comparison in all 14 medical center data. c ROC comparison of 14 medical center. * indicates a significant difference (p < 0.05, the p-value for the center E is 0.0005 and the p-value for the center H is 0.0055). # indicates that the AUC of V-EUS is greater than that of real EUS. Error bar indicates 95% confidence intervals of AUC. Source data are provided as a Source Data file.

